View Live GNSS Information
You can see the live information being reported by the receiver from the Diagnostics screen.
To access the Diagnostics screen from the Main Menu screen,
- Tap Diagnostics.
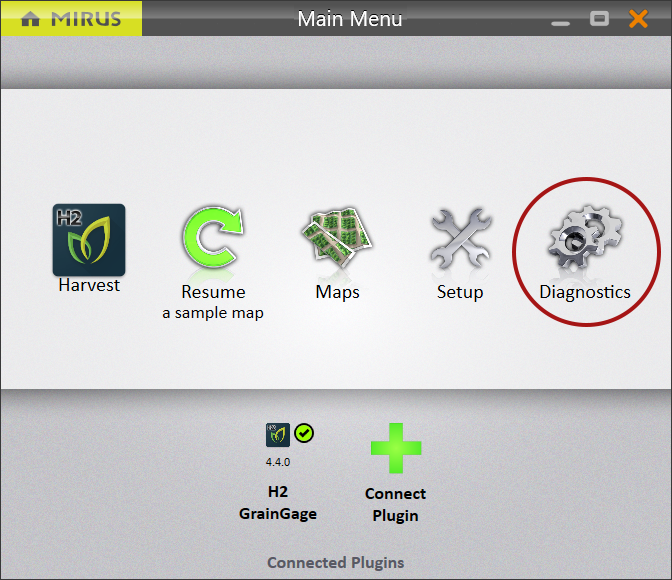
Mirus opens the Diagnostics box.
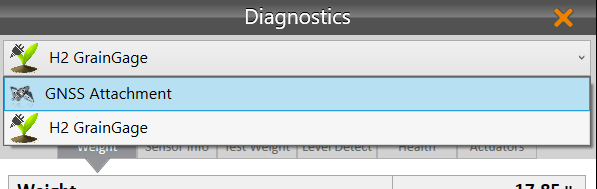
- If you are using the GNSS attachment, select GNSS Attachment from the dropdown list.
Note: If you are using the Note Taking device, you will skip this step.
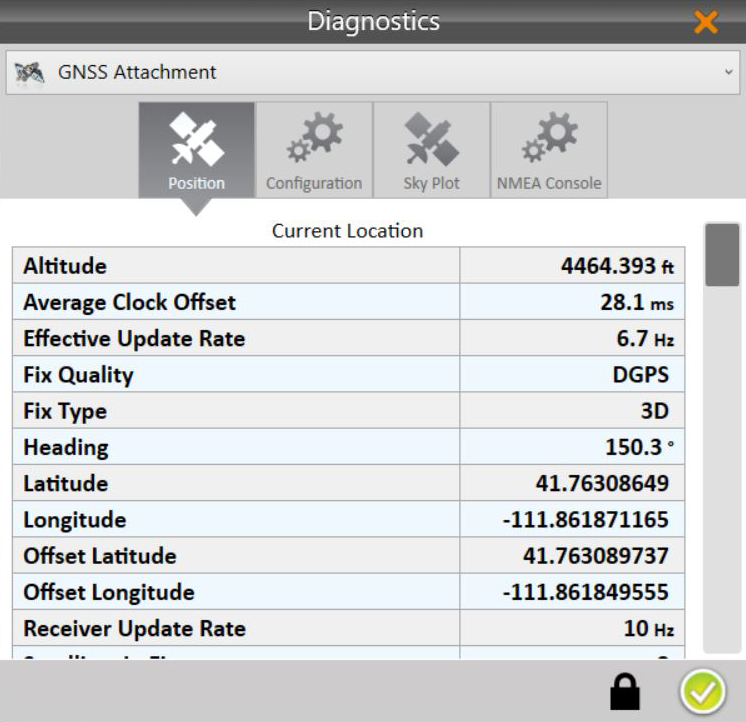
Position Diagnostics
On the Position Diagnostics screen, the position is shown live.
| Position Diagnostics | |
| Item | Description |
| Altitude* | The vertical elevation of your GNSS receiver above sea level. |
| Average Clock Offset | The measurement of the synchronization error between the satellite’s autonomous clock and the receiver’s clock. |
| Effective Update Rate | The rate at which the GNSS receiver is updating its position. |
| Fix Quality |
The type of positioning data being used by the receiver to determine the location.
|
| Fix Type |
The type of reference points (and calculations) being used to determine the position.
|
| Heading* | The compass direction you are driving. It is measured in degrees from the north magnetic pole. |
| Latitude* | The coordinate that specifies your north-south position on the Earth. |
| Longitude* | The coordinate that specifies your east-west position on the Earth. |
| Offset Latitude* | The latitude with offsets applied at the time the GrainGage cycle started (after the countdown time) when Distance Tripping is turned off. |
| Offset Longitude* | The longitude with offsets applied at the time the GrainGage cycle started (after the countdown time) when Distance Tripping is turned off. |
| Receiver Update Rate | The frequency at which the GNSS receiver calculates and reports its position. |
| Satellites in Fix | The number of satellites the receiver is using to calculate the position. |
| Speed* | The rate the GNSS receiver is traveling. |
| Threshold Heading | The last heading received above the speed threshold. |
|
Accuracy The position of GNSS satellites in the sky affects the accuracy of the location(s) reported by the GNSS receiver. The following values can help to ascertain greater positional precision. |
|
| EHE | Estimated Horizontal Error is provided by your GNSS receiver based on the number of reliable connections to GNSS satellites. |
| HDOP |
Horizontal Dilution of Precision A value between 1 – 20. One is an ideal connection. Ten is a moderate connection. Twenty is a poor connection. |
| PDOP |
Position (3D) Dilution of Precision A value between 1 – 20. One is an ideal connection. Ten is a moderate connection. Twenty is a poor connection. |
| VDOP |
Vertical Dilution of Precision A value between 1 – 20. One is an ideal connection. Ten is a moderate connection. Twenty is a poor connection. |
*Also in the backup log
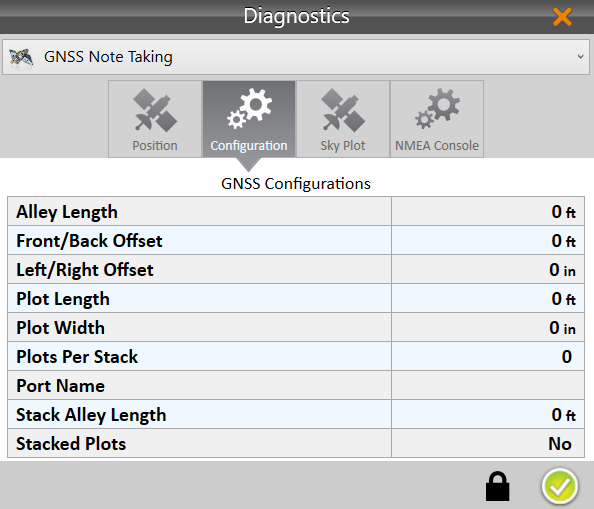
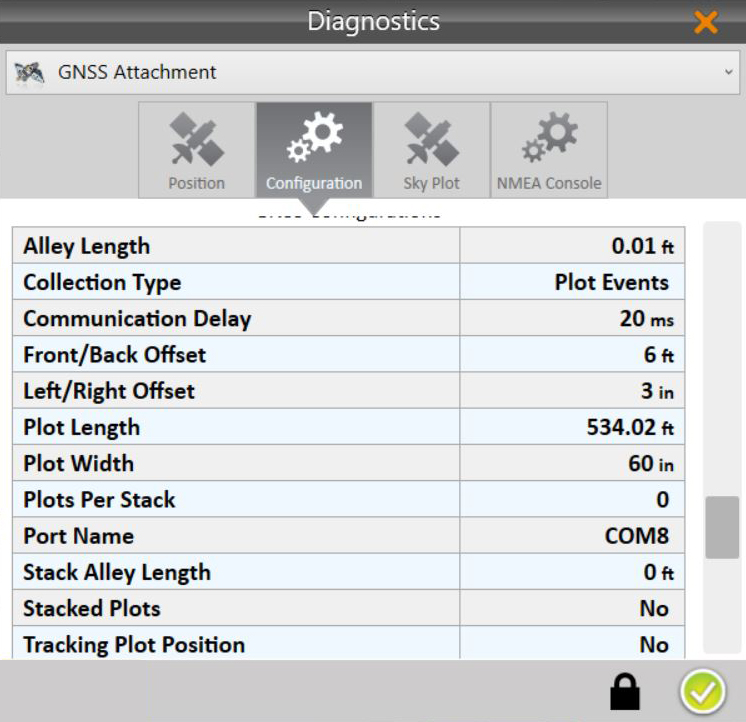
Configuration Diagnostics
The Configuration Diagnostics screen, shows the currently applied values.
|
|
| Configuration Diagnostics | |
| Item | Description |
| Alley Length | The length of the empty space where there are no plants between two plots. Enter this value in the AB Line Wizard for field dimensions. See Step 3 of Countdown Timer. |
| Collection Type* | The method, a plot event or enter press trigger, used to start the flush cycle of the GrainGage. See Adjust GNSS Settings. |
| Communication Delay* | Under typical conditions GNSS signal, cable, and amplifier delays are negligible. However, if an operator wanted to compensate for a communication delay, this field allows that. It is measured in milliseconds. |
|
Front/Back Offset* |
The value you entered as your front/back offset. (See Turn on Distance Trip.) The default value is 0. |
| Plot Length | The value you entered in the AB Line Wizard for plot length. See Step 3 of Countdown Timer. |
| Plot Width* | The value you entered in the AB Line Wizard for plot width. See Step 3 of Countdown Timer. |
| Plots per Stack | The number of plots grouped together to make one stack. Only used when Stacked Plots is on. See Step 3 of Countdown Timer. |
| Port Name | The port used by Mirus to make a serial connection to the GNSS receiver. The port is set automatically by the GNSS Port Detector. See Use the GNSS Port Detector. |
| Stack Alley Length | The longer distance between a group of stacked plots. See Step 3 of Countdown Timer. |
| Stacked Plots | Several plots grouped together. See Step 3 of Countdown Timer. |
| Tracking Plot Position* | A record of the averaged plot position is kept when “Yes” is displayed. It is not recorded when “No” is displayed. |
*GNSS Attachment only
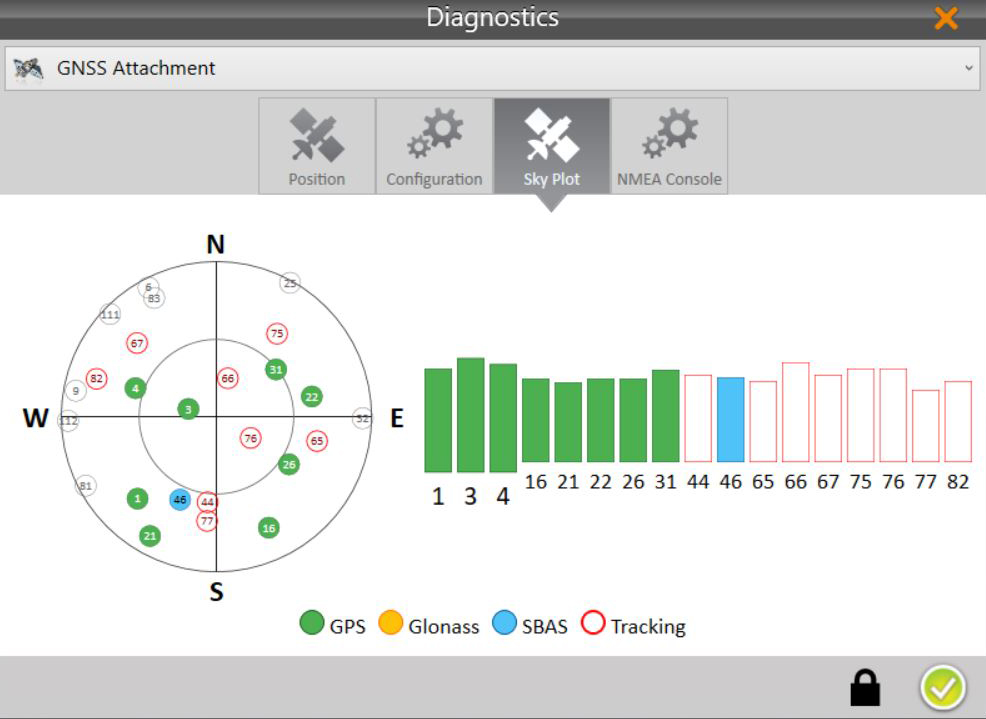
Skyplot Diagnostics
The Sky Plot Diagnostics screen shows the satellites used in the positioning solution and where they are in the sky.
On the Skyplot page, each satellite is identified by a space vehicle number (SVN) and color for its constellation. The location of each satellite on the Skyplot indicates where it resides in the sky overhead relative to true north. The outside ring is 0° elevation (horizon). The inside ring is 45° elevation—halfway above the horizon from the Geode’s present location. The intersection of the two lines indicates directly overhead.
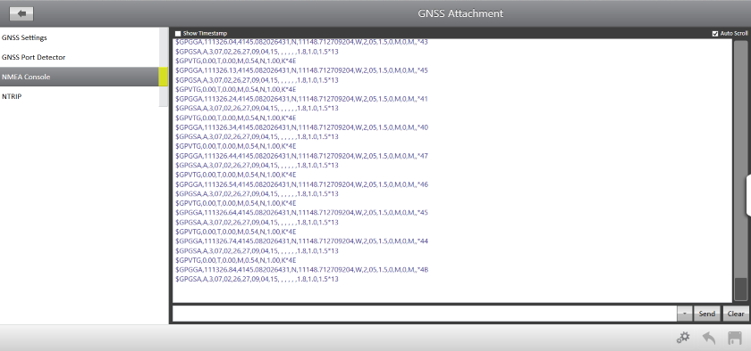
NMEA Console Diagnostics
The NMEA Console is explained in Access the NMEA Console.
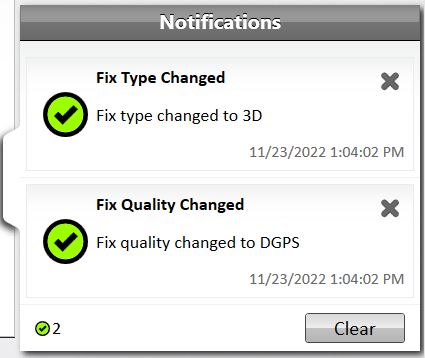
Alerts
When the fix type changes, you will see a green notification message for a good fix and yellow for a poor fix.