Field Maps
A map of your field is crucial for collecting your research data. You can create a map in Mirus or import an existing map. When you create a map, you decide where to store it and who has access. There are two places to store your map:
- Local Device—Stored on the device on which it is created or imported and accessible only from that device. No internet connection is required. A local map created in Mirus 5 can be synced to the cloud at a later time (see Cloud Sync). (A Mirus version 4.xx map imported remains local. It cannot be synced to the cloud.)
- Cloud—Stored on the cloud and distinguished by a cloud icon
 next to the map name. Allows multiple users to simultaneously collect data on the same map and access the map from the field or office. An internet connection is required to initially create the project.
With a cloud map:
- You can delete the map from a device but keep it in the cloud. To download the project to the device again, tap the download icon next to the map name.
- The map syncs to the cloud automatically or manually, depending on how you set up your cloud sync preferences (see Cloud Sync).
- You can collect data while the device is offline and sync the data when the device has an internet connection.
You can create a map in Mirus or import an existing map. You can export the data associated with your map as a CSV file or as a color-coded visual map in a spreadsheet. You can view, copy, or delete your map as needed. When creating a map, choose the one that best fits your field and research needs from the following map varieties:
- Range Row field map—a two-digit coordinate of range and plot number identifies the research plots in your field (See Create a Range Row Field Map)
- Four Row field map—used with twin GrainGage systems and automatically factors in border rows between each row of plots of the crop of interest (See Create a Four Row Map)
- Standard Plot ID field map—a unique ID number identifies each plot (See Create a Standard Plot ID Map)
- Sub-map—smaller division of an existing field map (See Create a Sub-Map.)
Create a Range Row Field Map
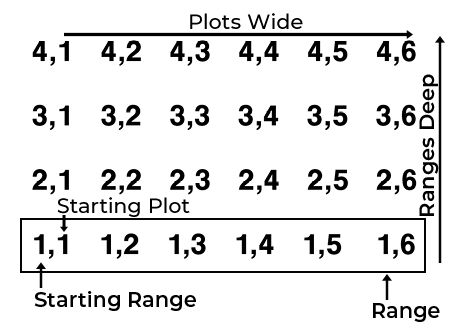
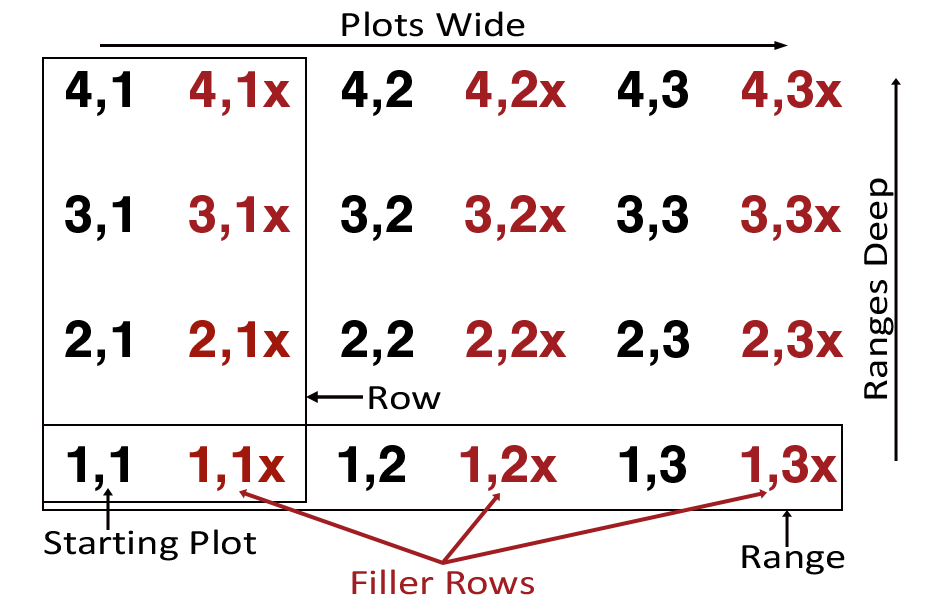
A range row field map describes your research field using a combination of numbered ranges and plots to create a coordinate system. The first number in the coordinate pair indicates the range. The second number indicates the plot. The coordinate pair is separated by a comma: Range, Plot.
Numbering starts with the bottom left corner of the field. Range numbering counts from bottom to top. Plot numbering counts from left to right and is repeated through the ranges.
When creating a new map, you will define your field by entering numbers for the following attributes.
|
Field Map Attributes |
||
|---|---|---|
| Option | Description | Typical Value |
| Ranges Deep | The number of ranges within a given field. | |
|
Starting Range |
The number of the first range. | 1 |
| Range Increment |
The numeric interval between ranges. |
1 |
|
Plots Wide |
The number of plots across a given field. | |
|
Starting Plot |
The number of the bottom left plot. | 1 |
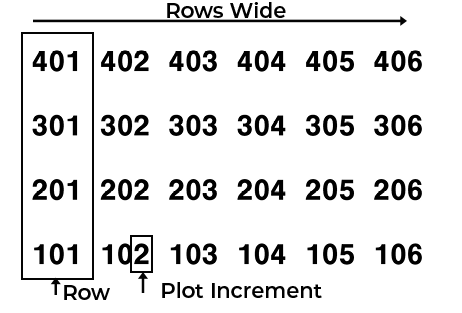
| Plot Increment |
The numeric interval between plots. Row crops often use the plot increment number to count the number of plants planted across the plot. So the coordinate pair identifying the plot is the number of the left-most row of plants in the plot. If plots contained 2 corn plants, the increment would be set to 2. The first plot would be identified by coordinates 1,1. The second plot’s coordinates would be 1,3. |
1
|
The field map illustrated below was created using the following settings:
- Ranges deep: 4
- Range increment: 1
- Starting Range: 1
- Plots wide: 6
- Plot increment: 1
- Starting plot: 1
To create a Range Row map,
- Tap Maps.
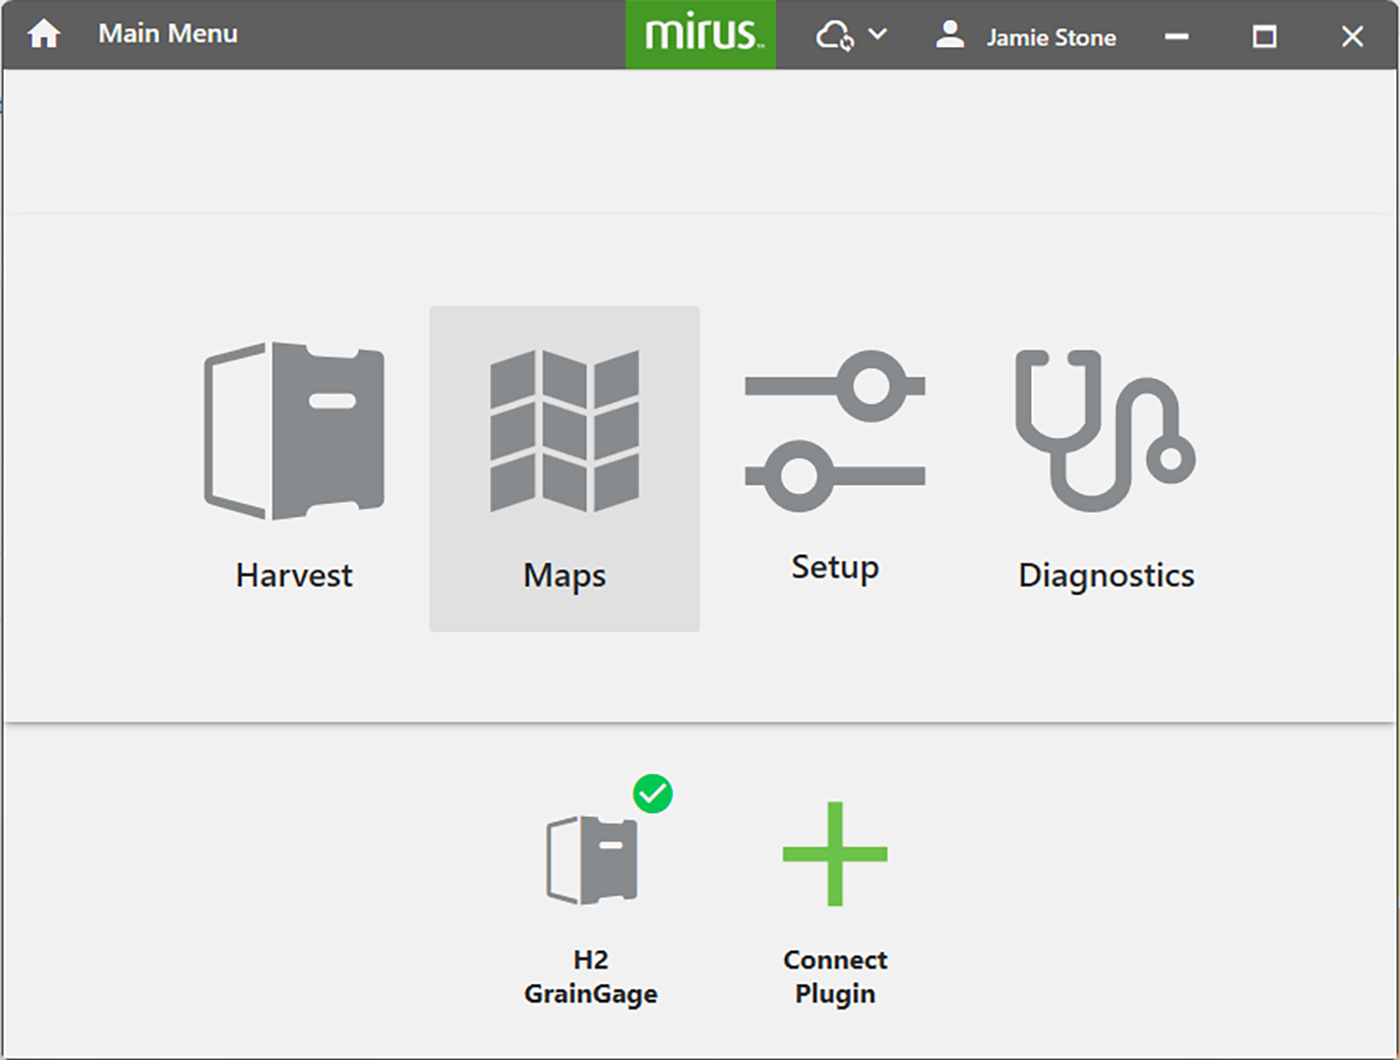
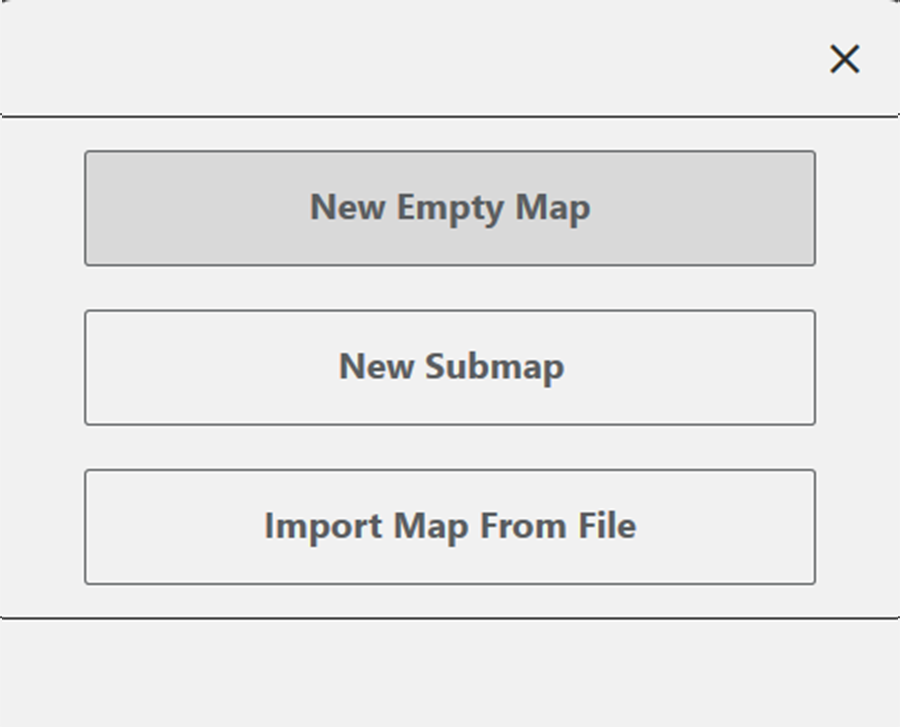
- Tap New.
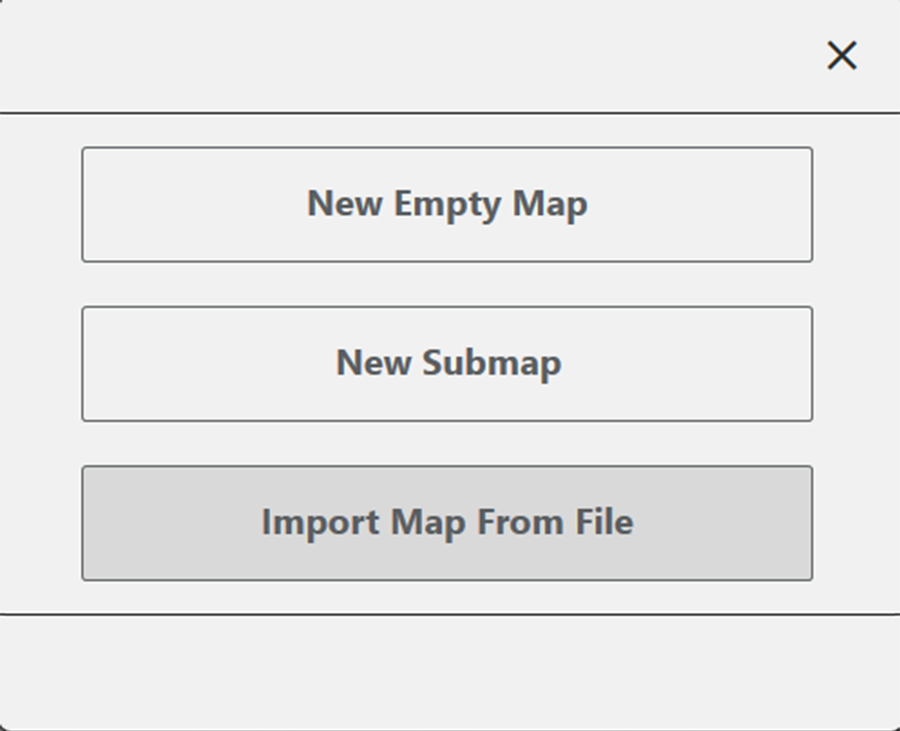
- Select New Empty Map.
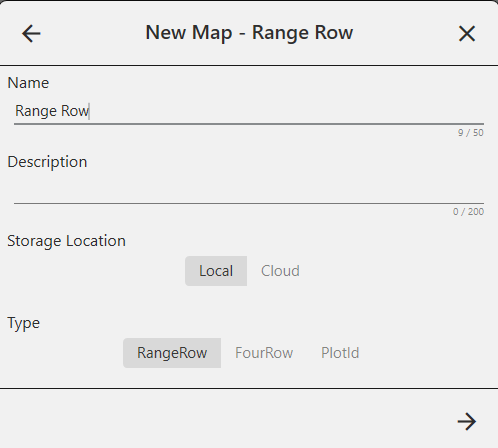
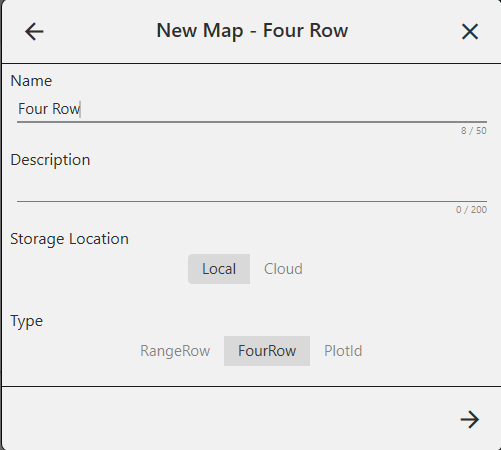
- Name and describe the map.
The Name box will only accept basic letters and numbers. Do not use emojis or the following special characters: > < : ” \ ? | / * - Select the storage location.
- Local—Saves the map to the device. Requires no internet connection.
- Cloud—Saves the map to the cloud. Requires an internet connection to create.
- Tap Range Row.
The Four Row option only applies to Twin plot systems.
- Tap
 .
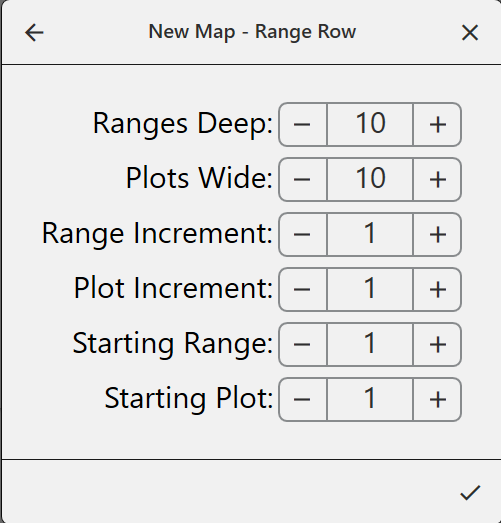
. - Set the following:
- Ranges deep
- Plots wide
- Range increment
- Plot increment
- Starting range
- Starting plot
- Tap the check icon
 to save the map.
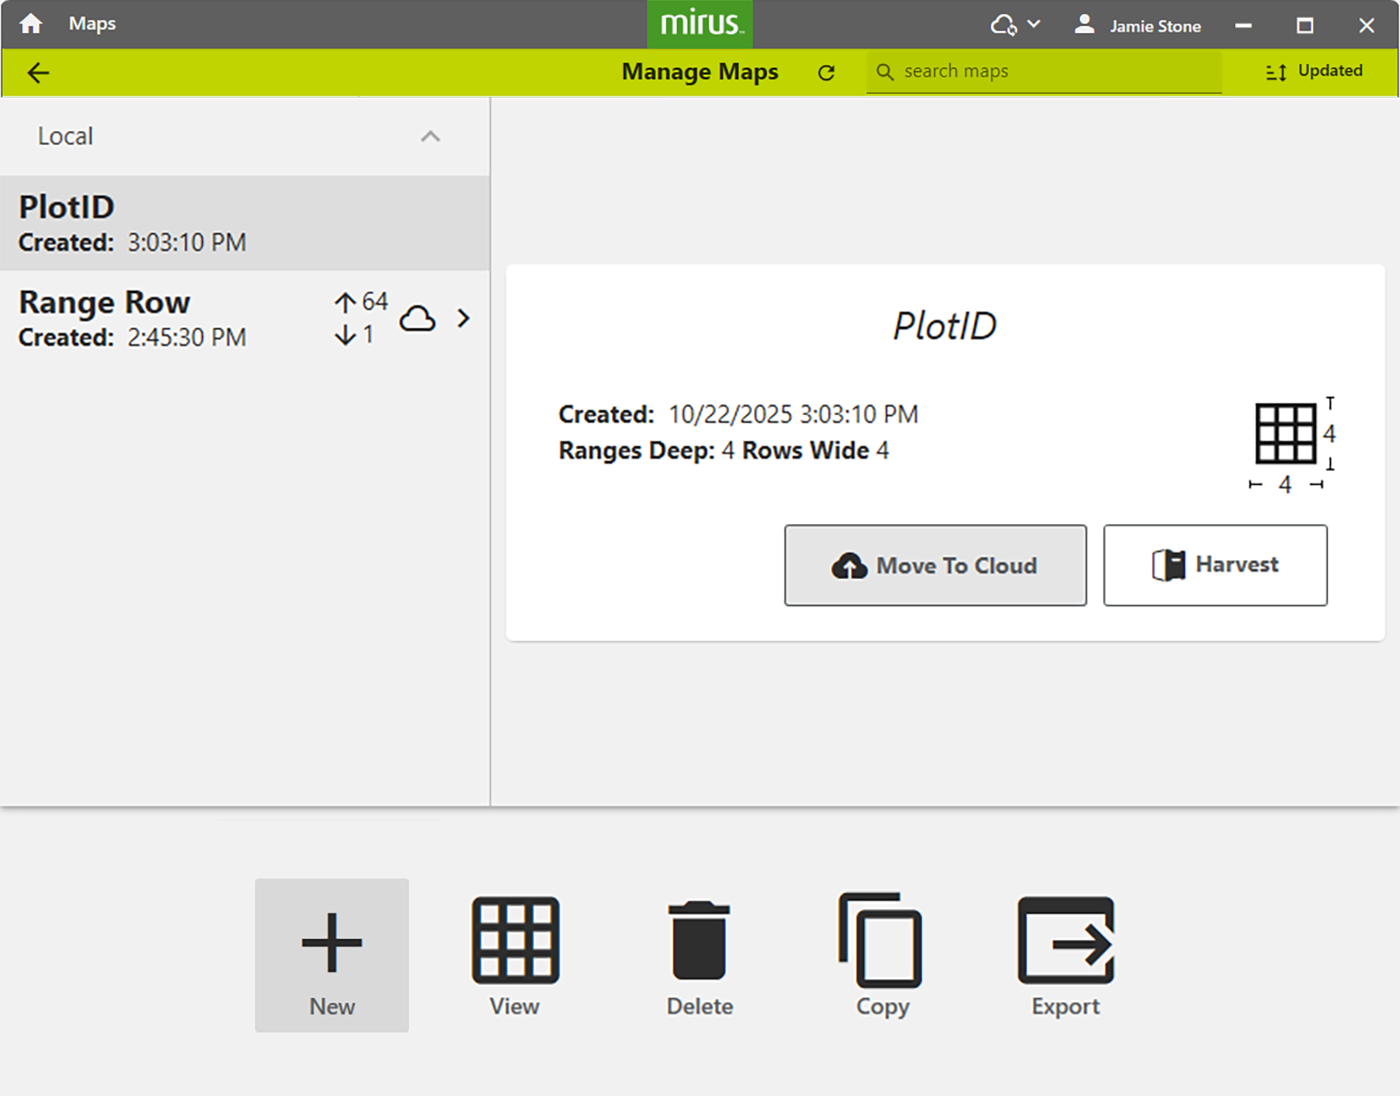
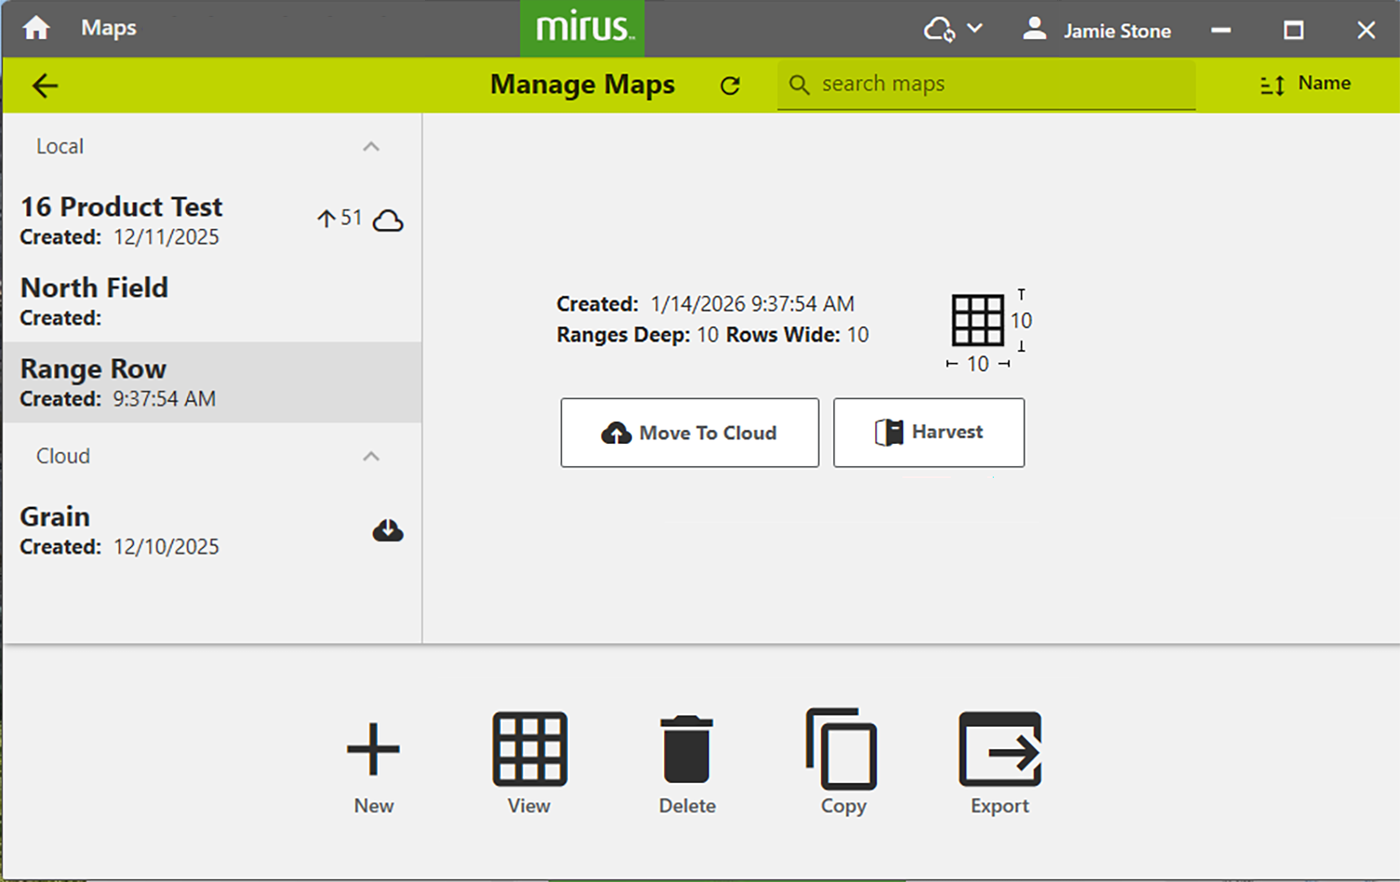
Mirus displays a description of the map on the Manage Maps screen. From this screen, Mirus allows you to do the following with your maps:
- Create new
- View
- Delete
- Copy
- Export
Depending on your map, you may also have options to:
- Begin or resume harvest
- Begin note taking
- Manage users
- Sync
- Download
- Move to cloud
Create a Four Row Map
A four-row field map describes your research field using a combination of numbered ranges, plots, and filler rows (aka border or x plots) to create a coordinate system. The first number in the coordinate pair indicates the range. The second number indicates the plot. An x following the coordinate pair indicates the filler row. The coordinate pair is separated by a comma: Range, Plot.
The data collected for filler rows is only accessible in the backup file. Filler row data will not export.
Numbering starts with the bottom left corner of the field. Range numbering counts from bottom to top. Plot numbering counts from left to right and is repeated through the ranges.
When creating a new map, you will define your field by entering numbers for the following attributes.
|
Field Map Attributes |
||
|---|---|---|
| Option | Description | Typical Value |
| Ranges Deep | The number of ranges within a given field. | |
|
Starting Range |
The number of the first range. | 1 |
| Range Increment |
The numeric interval between ranges. |
1 |
|
Plots Wide |
The number of plots across a given field. | |
|
Starting Plot |
The number of the bottom left plot. | 1 |
| Plot Increment |
The numeric interval between plots. Row crops often use the plot increment number to count the number of plants planted across the plot. So the coordinate pair identifying the plot is the number of the left-most row of plants in the plot. If plots contained 2 corn plants, the increment would be set to 2. The first plot would be identified by coordinates 1,1. The second plot’s coordinates would be 1,3. |
1 |
The field map illustrated below was created using the following settings:
- Ranges Deep: 4
- Plots Wide: 3
- Range increment: 1
- Plot increment: 1
- Starting Range is 1
- Starting plot is 1
To create a Four Row map:
- Tap Maps.
- Tap New.
- Select New Empty Map.
- Name and describe the map.
The Name box will only accept basic letters and numbers. Do not use emojis or the following special characters: > < : ” \ ? | / * - Select the storage location.
- Local—Saves the map to the device. Requires no internet connection.
- Cloud—Saves the map to the cloud. Requires an internet connection to create.
- Tap Four Row.
- Tap .
The Name box will only accept basic letters and numbers. Do not use emojis or the following special characters: > < : ” \ ? | / * - Set the following:
- Ranges deep
- Plots wide
- Range increment
- Plot increment
- Starting range
- Starting plot
- Tap to save the map.
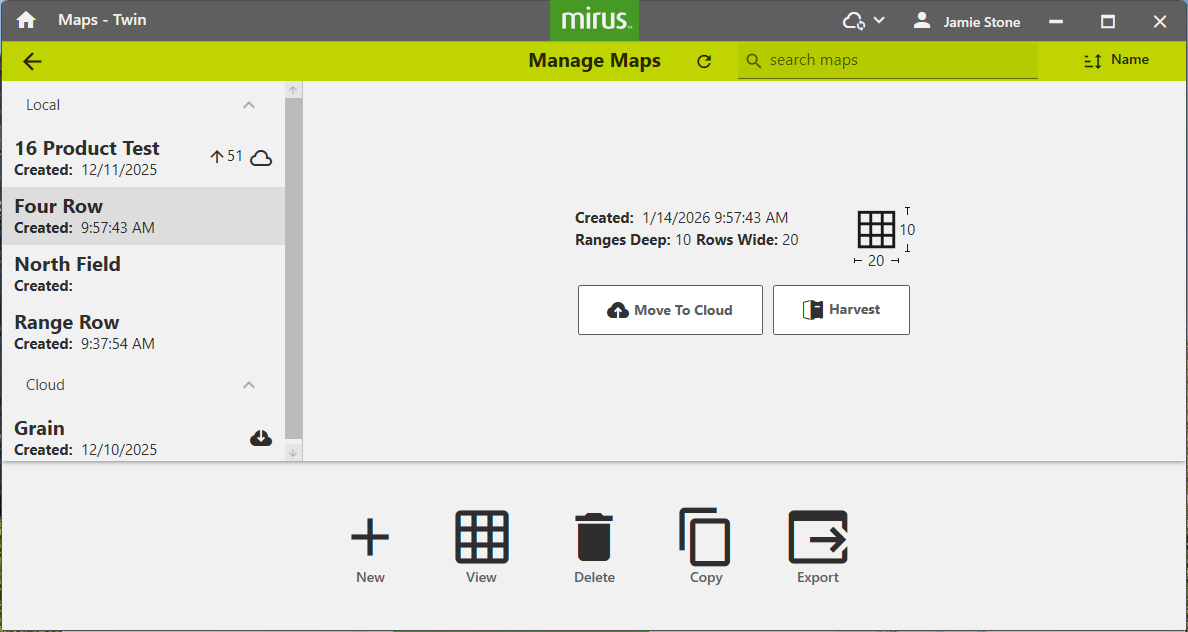
Mirus displays a description of the map on the Manage Maps screen. From this screen, Mirus allows you to do the following with your maps:
- Create new
- View
- Delete
- Copy
- Export
Depending on your map, you may also have options to
- Begin or resume harvest
- Begin note taking
- Manage users
- Sync
- Download
- Move to cloud
Create a Standard Plot ID Map
A standard Plot ID map gives a unique ID number to each plot. Numbering begins with the bottom left corner of a field and counts up. Plots in a horizontal line on the map are called a range. The plot ID map is very customizable. You can adjust the counting increments (e.g. 1, 10, 100), the direction the number sequence will be applied from the lower left corner of the field, the pattern in which the numbers flow through the field. You can also add replications, repeated groupings of plots. A replication could be less than a range or encompass multiple ranges.
When creating a new map, you will define your field by entering numbers for the following attributes.
|
Field Map Attributes |
||
|---|---|---|
| Option | Description | Typical Value |
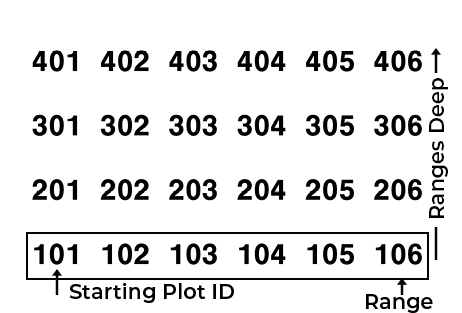
| Ranges Deep |
The number of ranges within a given field. Mirus allows up to 999 ranges, but your field ID number could contain five digits, depending on your other settings. |
|
| Rows Wide |
The number of plots across a given field. Plots grouped together from bottom to top form a row. So, it is also the number of rows within the field. Each row is equal to one plot. If you have multiple row crop plants in each plot, the Mirus row is the plot, not the plants. |
|
| Starting Plot ID | The number of the bottom left plot. | |
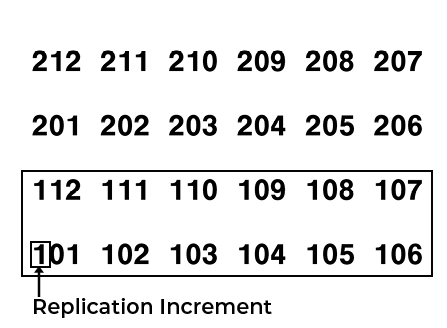
| Plots per Replication | The number of grouped plots to be repeated. | |
| Replication Increment | The numeric interval between the first plots in each replication (e.g., 100 or 1000). | |
| Plot Increment | The numeric interval between plots. | 1 |
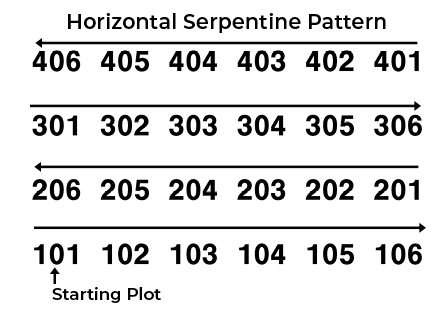
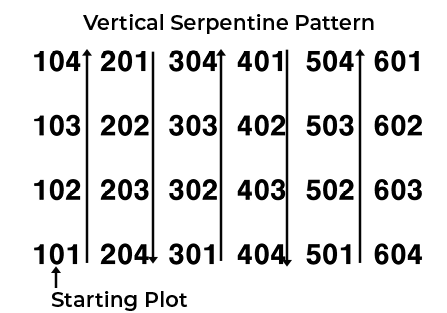
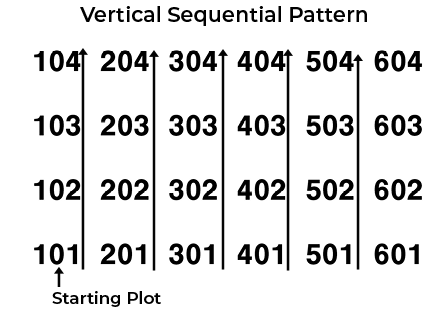
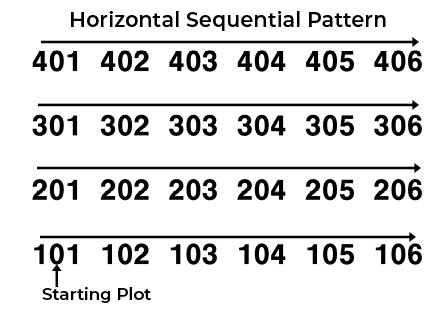
| Pattern |
The path in which the numbers flow through the field. Choose serpentine or sequential. |
|
| Direction | The way that the numbers are counted through the field. Choose to count the plot numbers from left to right (horizontal) or bottom to top (vertical). | |
In order to collect the correct data, the map pattern and direction should follow the pattern used to plant the field. It doesn't matter if your pattern for harvesting matches.
|
Illustrations of Standard Plot ID Field Map Options |
|
|---|---|
| Options | Illustration |
|
  |
|
 |
|
 |
|
 |
|
|
|
 |
*default value
To create a standard Plot ID map:
- Tap Maps.
- Tap New.
- Select New Empty Map.
- Name and describe the map.
The Name box will only accept basic letters and numbers. Do not use emojis or the following special characters: > < : ” \ ? | / * - Select the storage location.
- Local—Saves the map to the device. Requires no internet connection.
- Cloud—Saves the map to the cloud. Requires an internet connection to create.
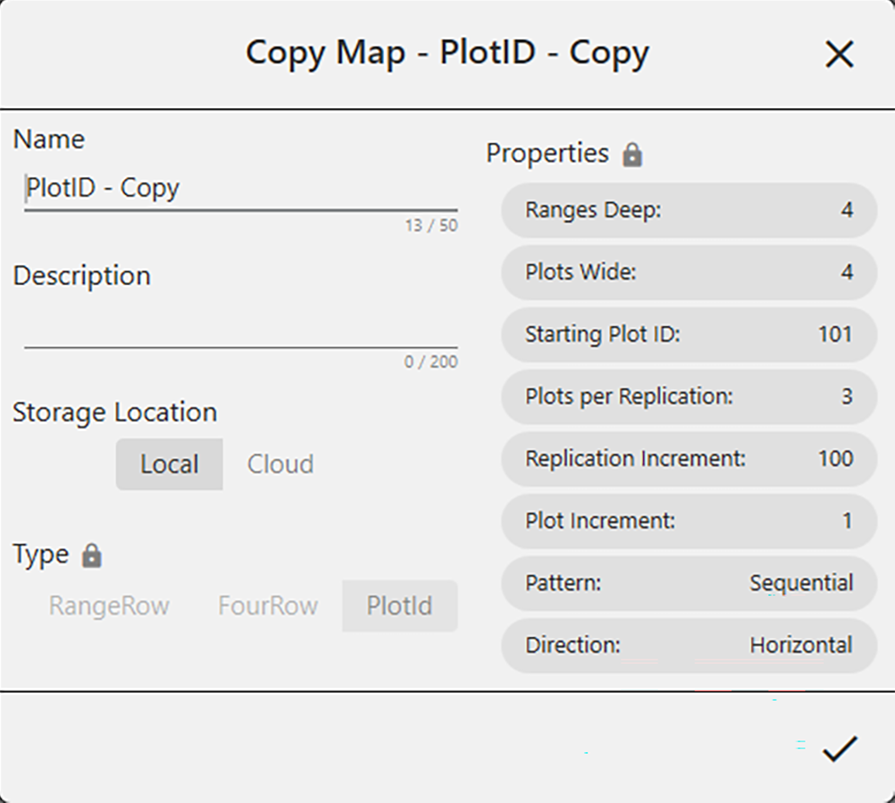
- Tap PlotID.
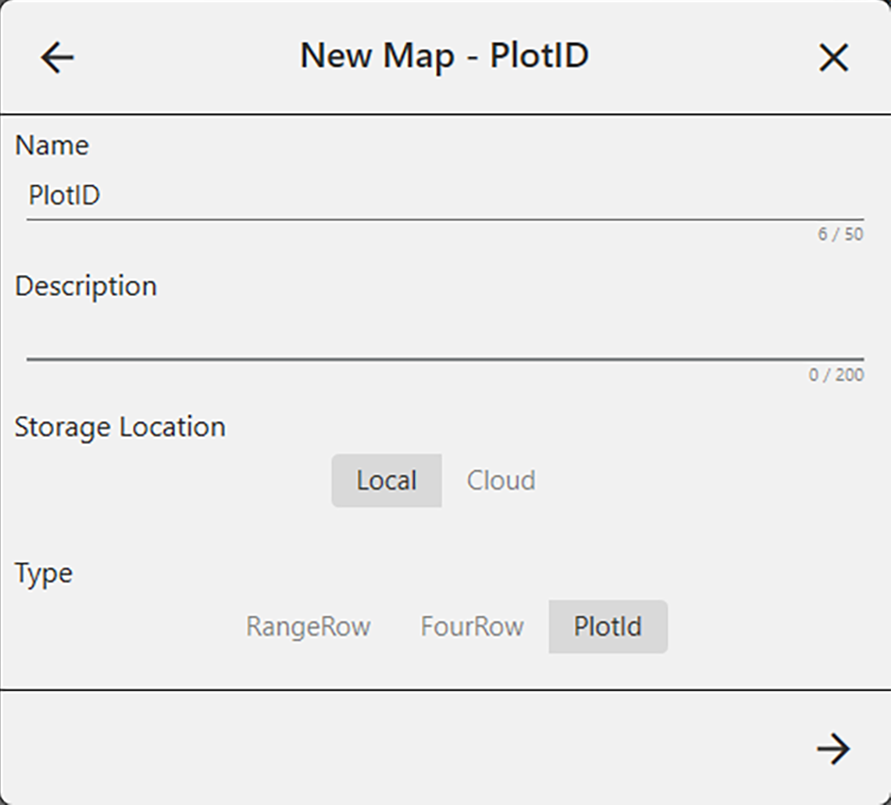
- Tap .
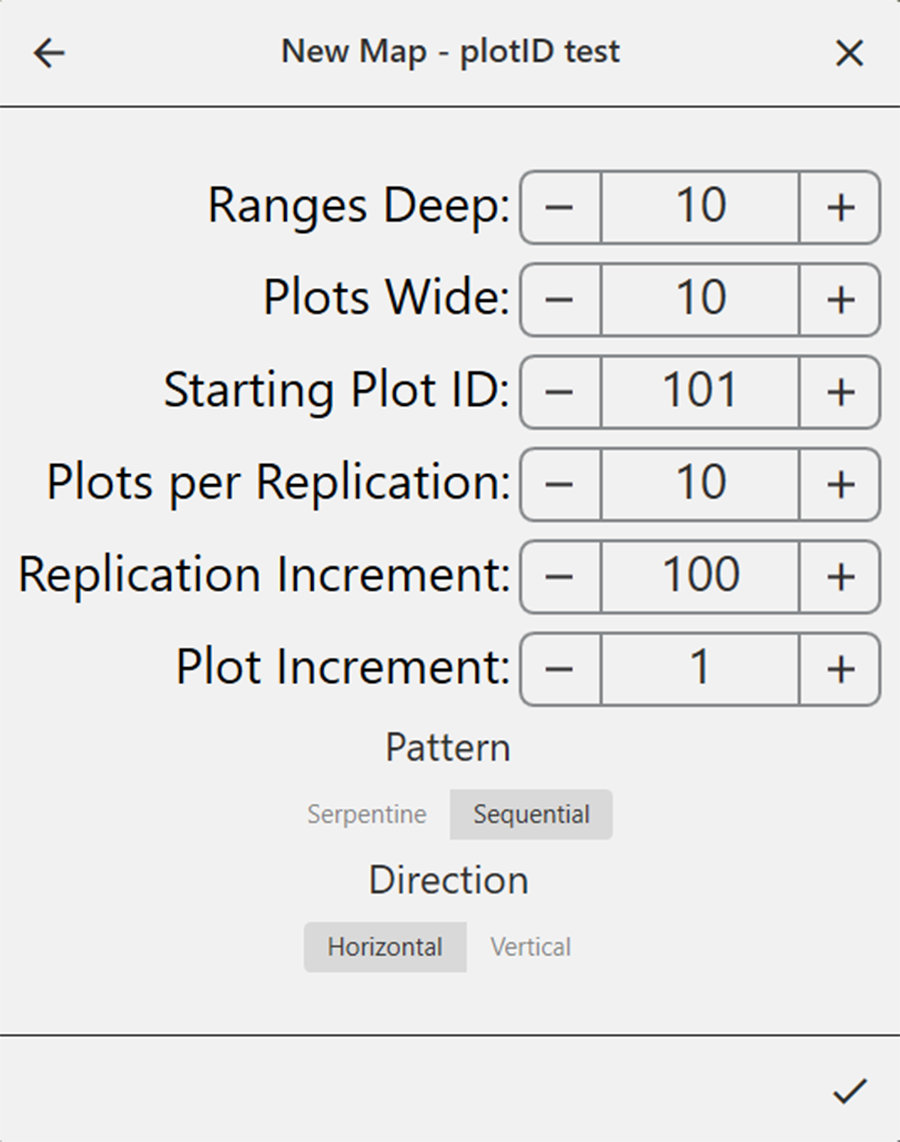
- Set the following:
- Ranges deep
- Rows wide
- Starting plot ID
- Plots per replication
- Replication increment
- Plot increment
- Pattern
- Serpentine. The numbering of map plots winds through the plots.
- Sequential. The numbering of map plots advances consistently from the bottom left.
- Direction
- Horizontal. The numbering of map plots advances from the bottom left to the right.
- Vertical. The number of map plots advances from the bottom to the top.
- Tap to save the map.
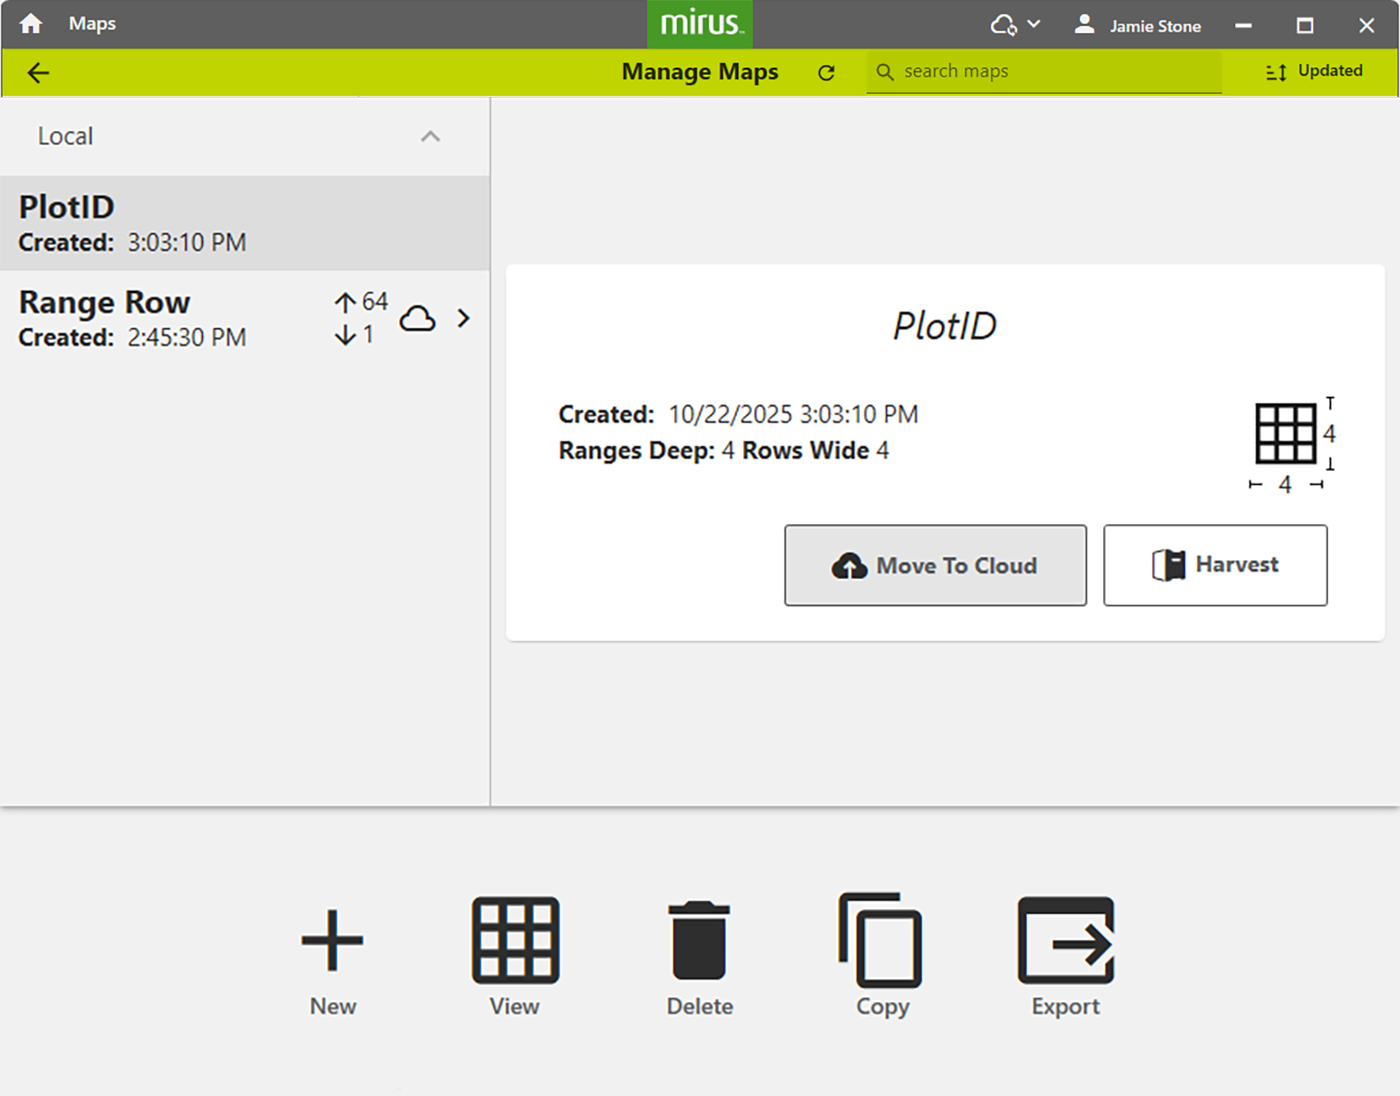
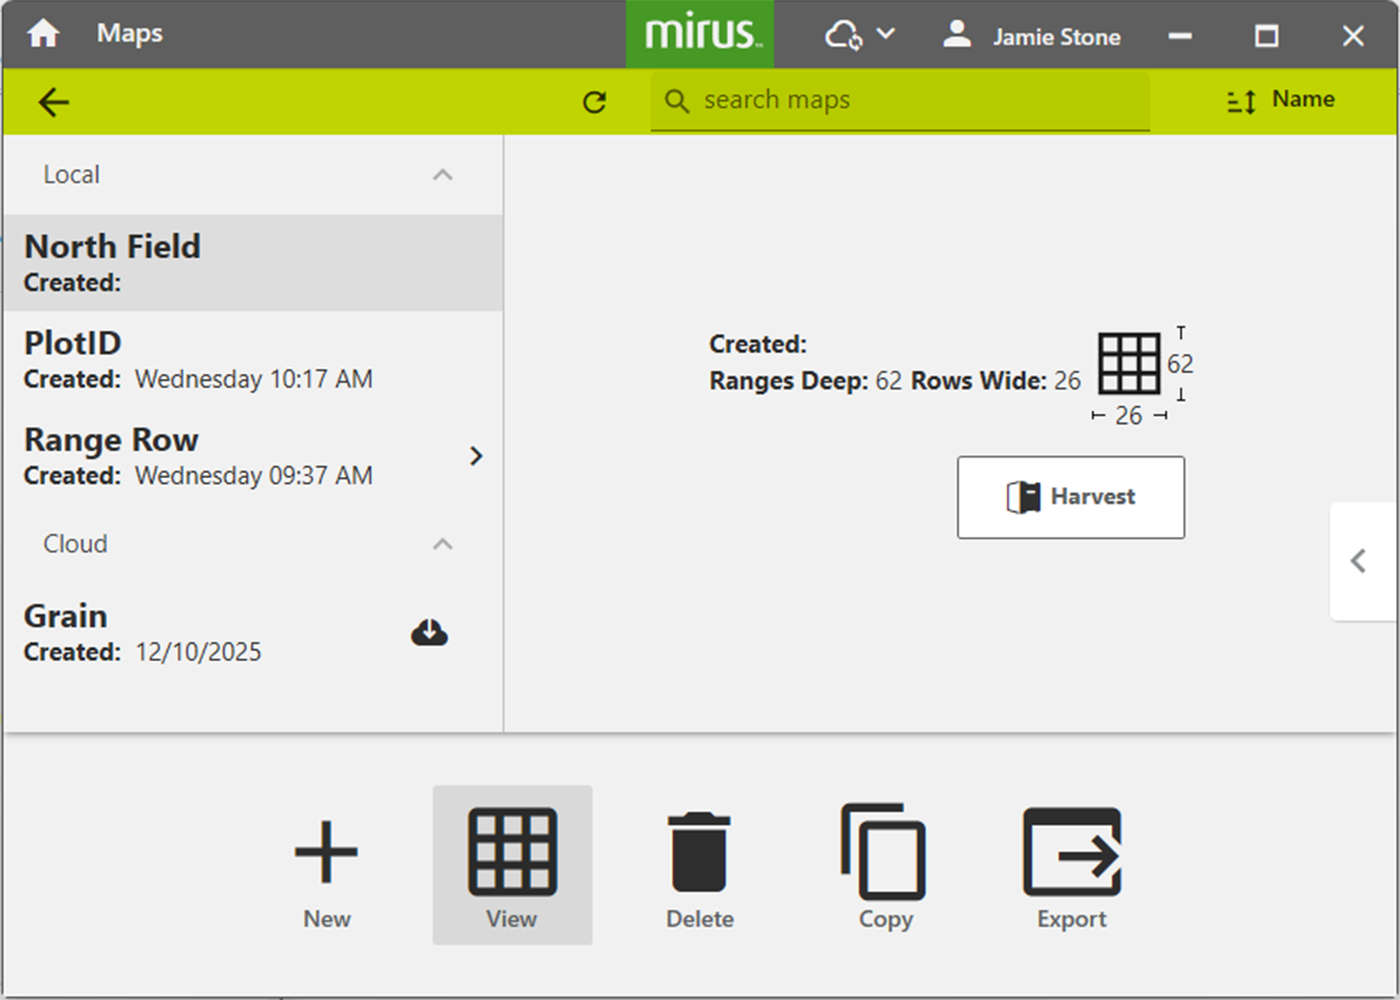
Mirus displays a description of the map on the Manage Maps screen.
From this screen, Mirus allows you to do the following with your maps:
- Create new
- View
- Delete
- Copy
- Export
Depending on your map, you may also have options to:
- Begin or resume harvest
- Begin note taking
- Manage users
- Sync
- Download
- Move to cloud
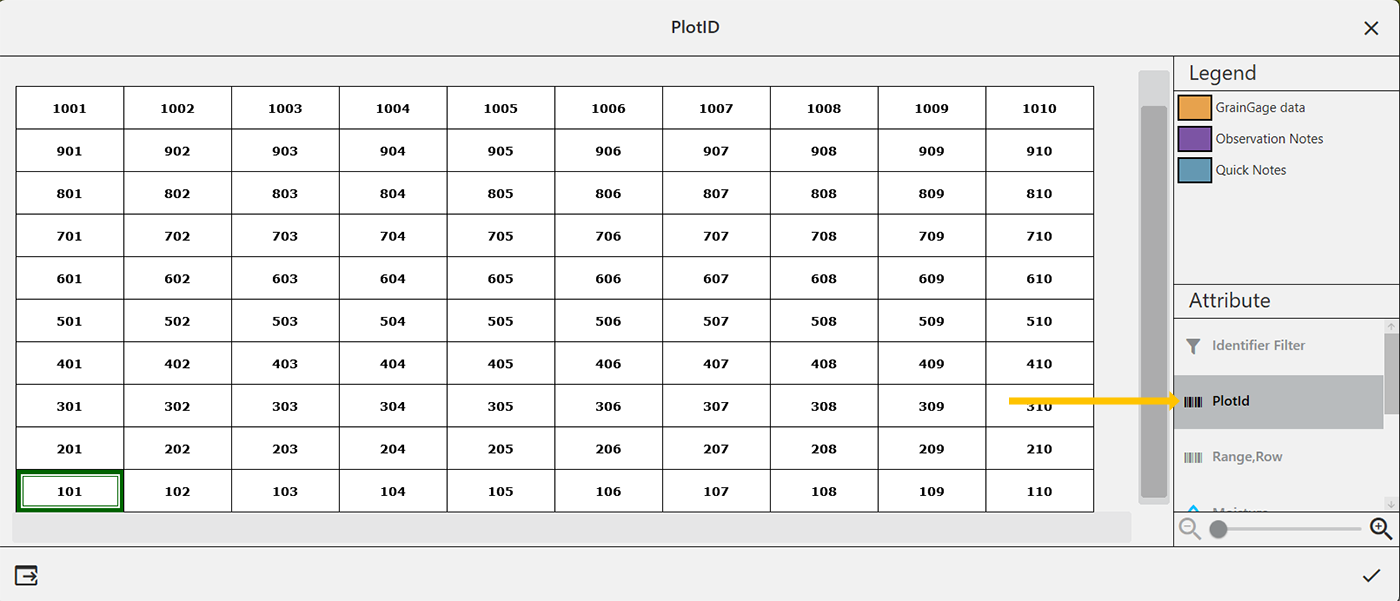
Note: In Map View, Mirus initially displays Standard Plot ID maps as Range Row maps. To display the plot IDs, select Plot ID under Attribute.
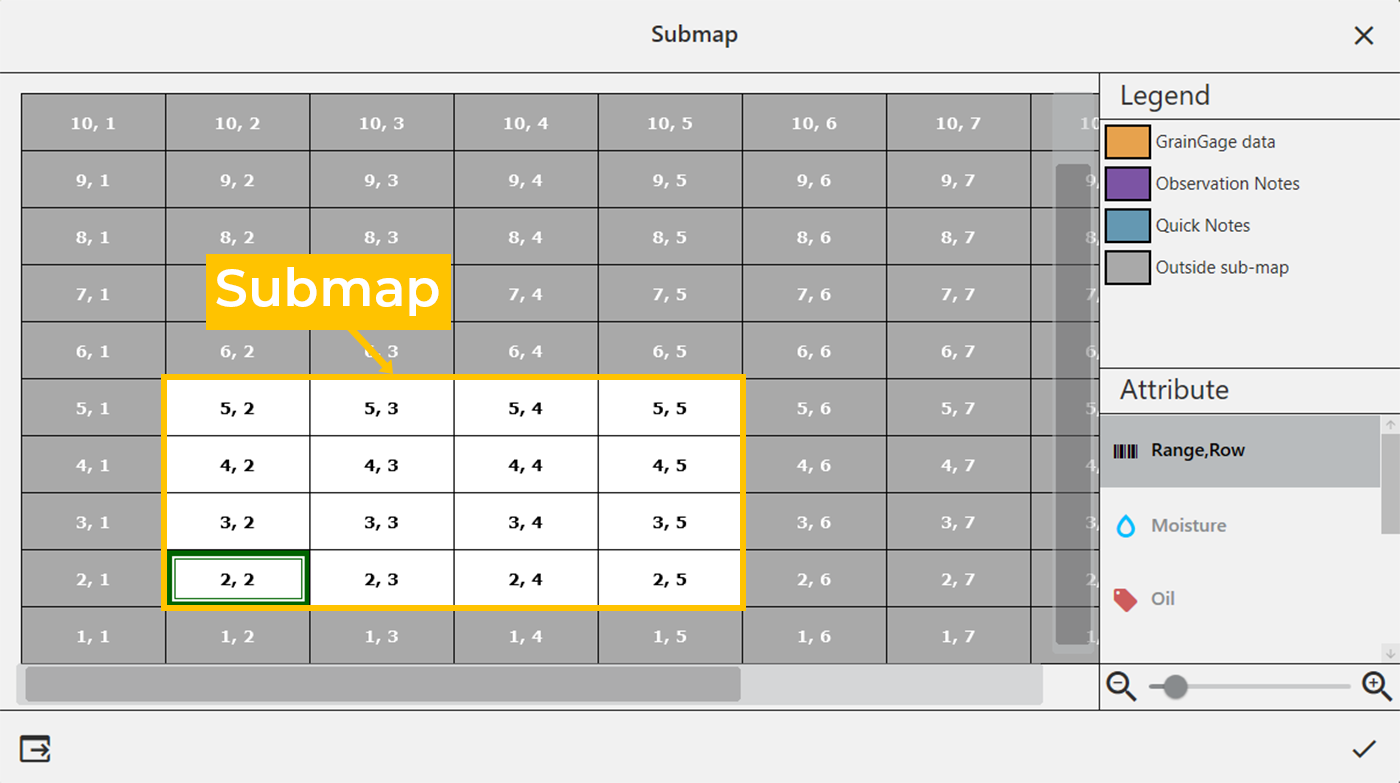
Create a Sub-Map
Mirus allows the creation of sub-maps, smaller divisions of the larger field maps.
To create a sub-map:
- Tap Maps.
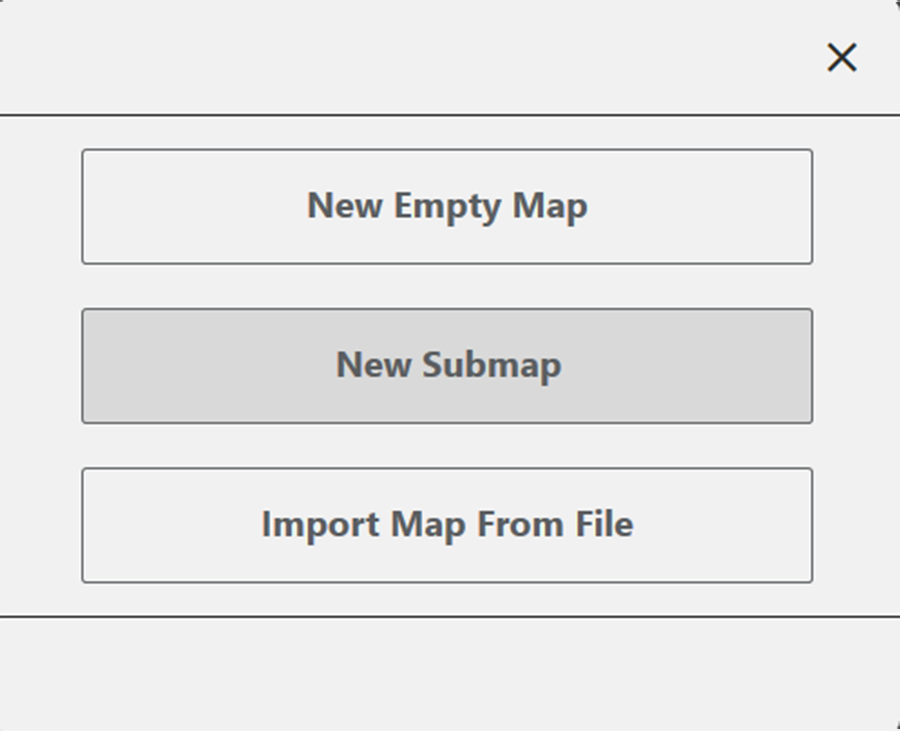
- Tap New.
- Select New Submap.
- Select the map which will include the submap.
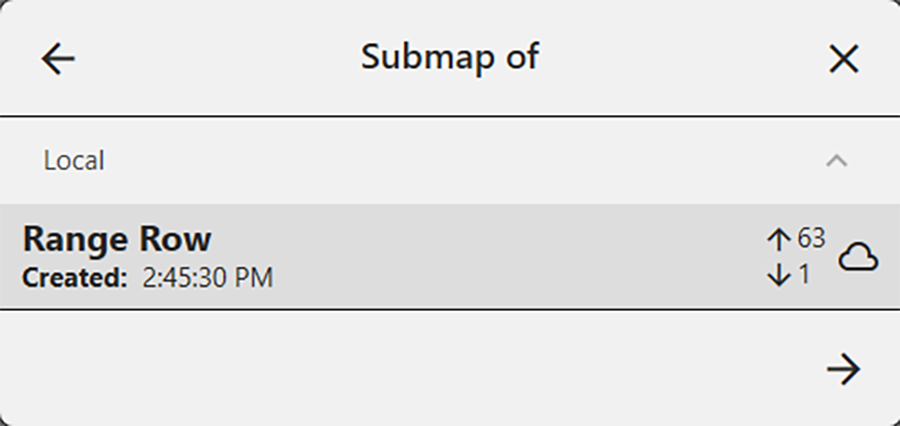
- Tap .
- Name and describe the map.
The Name box will only accept basic letters and numbers. Do not use emojis or the following special characters: > < : ” \ ? | / *
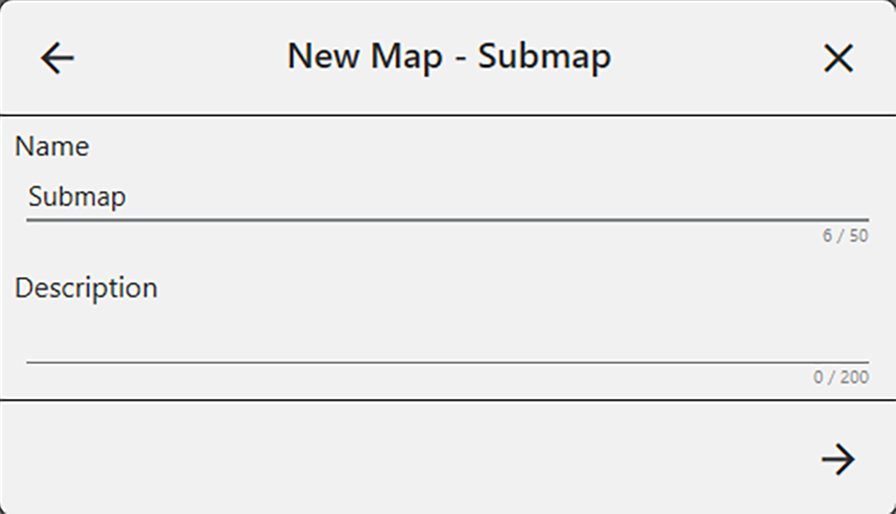
- Tap .
- The plot and range increments are the same as the larger field map. Set the following:
- Starting range
- Starting row
- Ending range
- Ending row
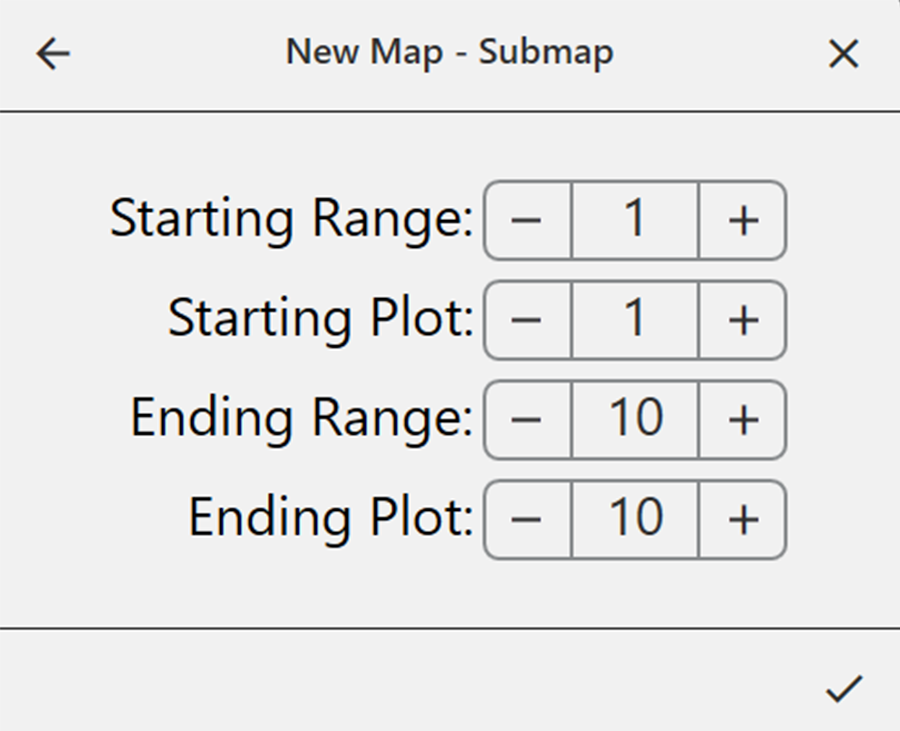
- Tap the to save the map.
- On the Manage Maps screen, Mirus displays the sub-map under the main field map it is a part of.
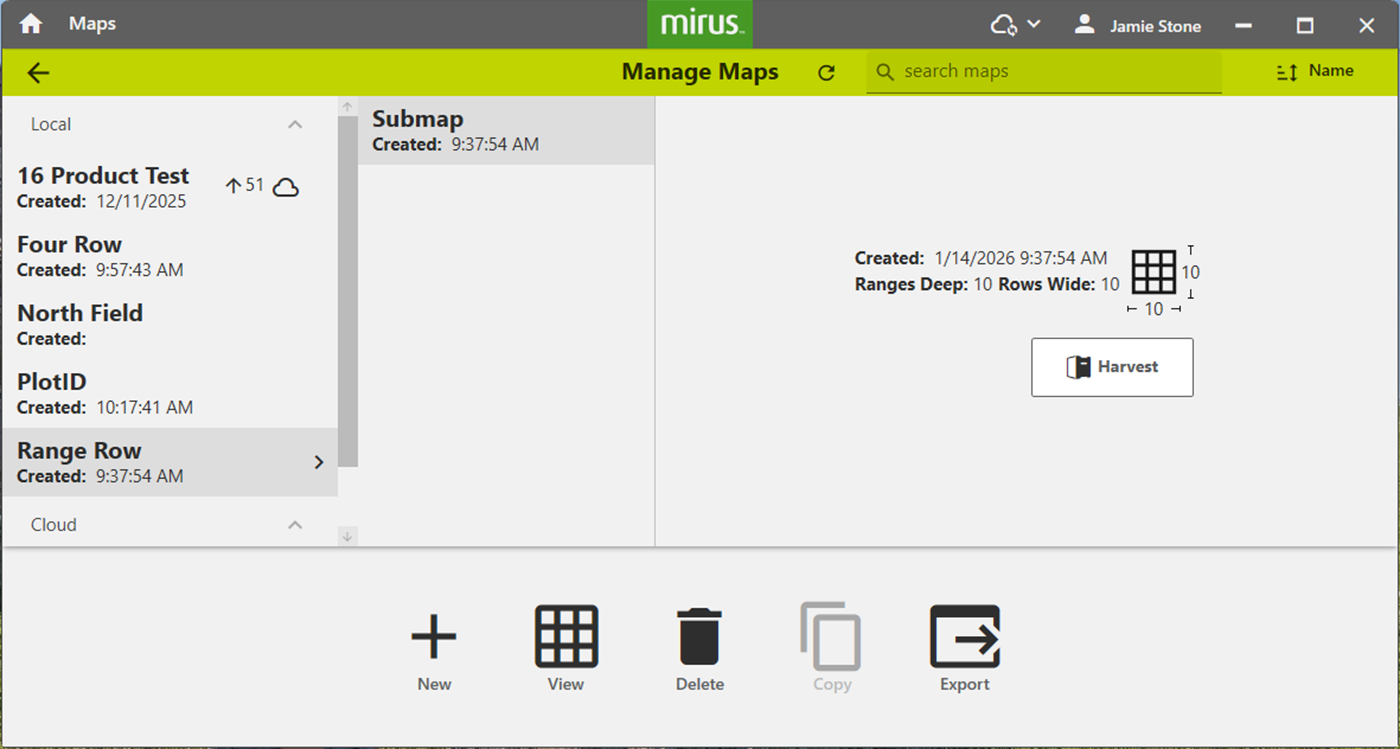
Tap view to see the submap.
Import a Map
In Mirus you can easily import maps created in Microsoft Excel or research programs such as PRISM® and AGROBASE®. This can be done in Range Row and Two Dimensional (2D) formats. The imported field map may include information such as Range, Row, Replication, Pass, Pedigree, or other plot identifiers. You can view these identifiers when you use the imported map to Harvest. (For more information, refer to Graph View, Collect Harvest Data and List View.)
The main benefit of importing maps is that you can include additional identifiers (in addition to range and row) for each plot.
Identifiers can be seen in the following places:
- Harvest, Graph view—Up to three additional identifiers can be displayed.
- Harvest, Spatial view—Any single identifier can be selected from the Attribute pane to label the plots.
- Harvest, List view—Identifiers show in the left pane.
Import Existing Maps
If you have existing map (.hmf from Mirus 4, .hmdb Mirus 5), you can import the file by dragging and dropping the file into the Home screen or the Manage Maps screen.
A .hmf Mirus 4 map format cannot be uploaded to the cloud.
Import a Range Row Map
Range row maps need to be in CSV format in order to be imported. Following is an importable range row map file. The header row must include columns for range and row. Additional columns are optional. If you will be harvesting border plots, do not forget to include them in your map.
In the example below, notice the columns PLTID and study.
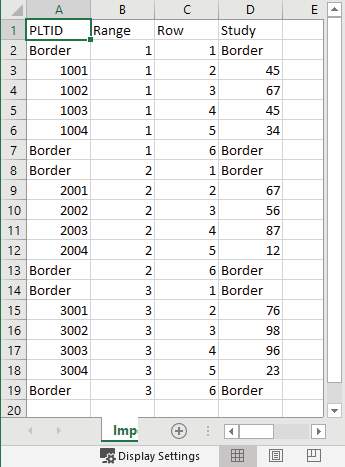
Note: The CSV data for the range row map is a list. The data for the ranges and rows must be entirely numeric; however, the columns can have any name. During the import process, Mirus allows you to select which of the columns of numbers to use as the Range and Rows.
Note: Only basic letters and numbers are accepted in the spreadsheet. Do not use emojis or the following special characters: > < : ” \ ? | / *
To import a Range Row map:
- Tap Maps.
- Tap New.
- Select Import Map from File.
- Navigate to and select the desired file.
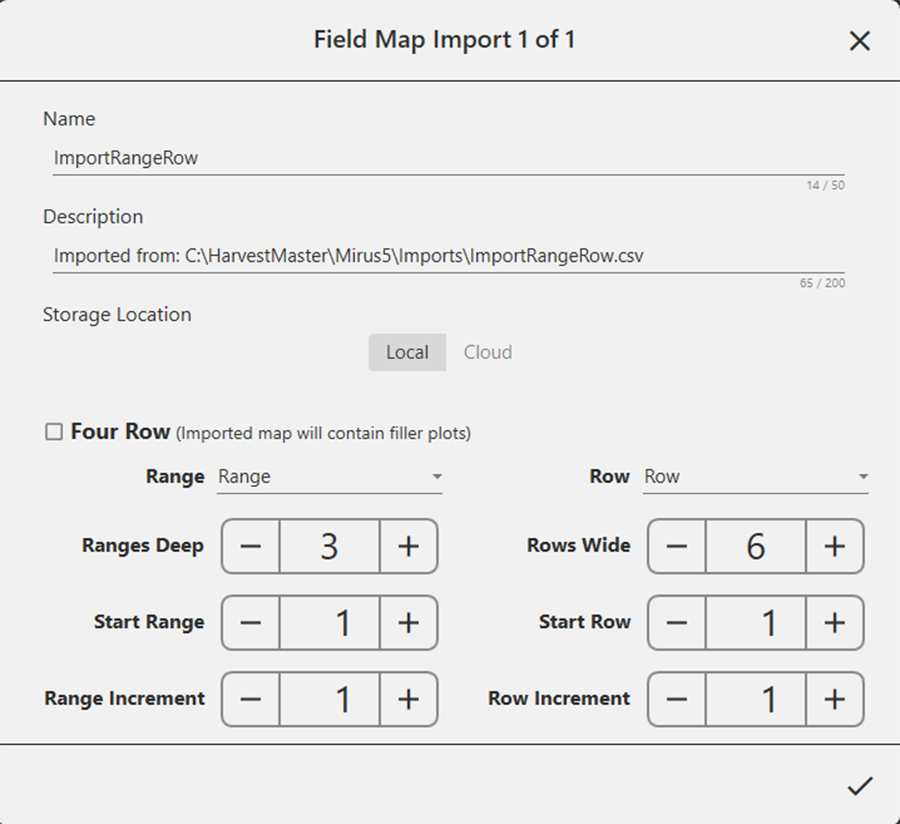
- Check the values displayed by Mirus and make sure they reflect the map you are importing. If necessary, change the columns designated as Range and Row by clicking on their respective drop-down menus.
Tap the drop-down menus to display other options for the range and row columns.
- Tap .
On the Manage Maps screen, Mirus displays a notification that the map has been imported successfully.
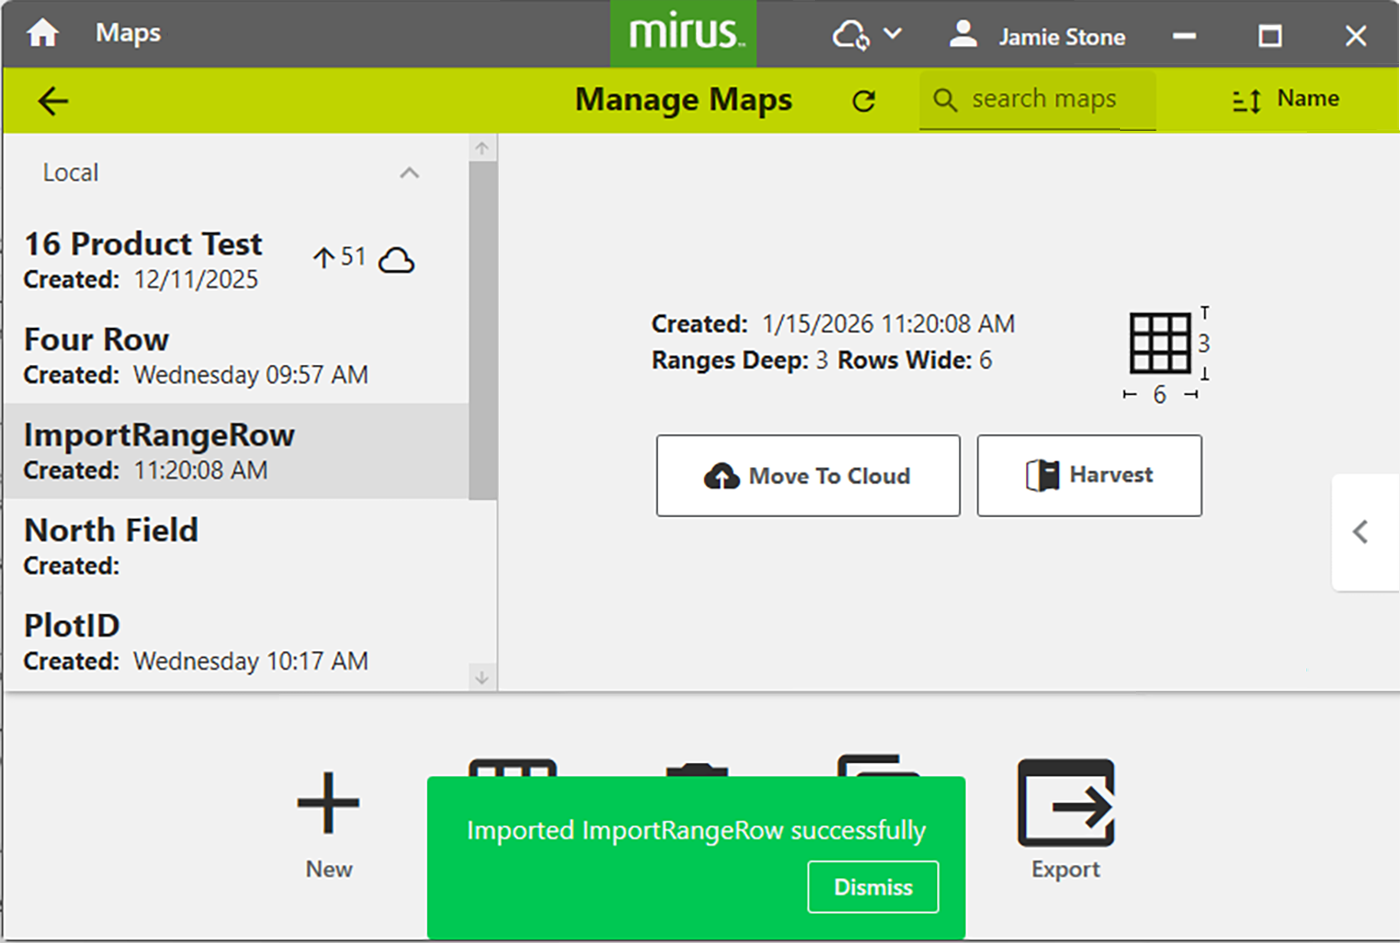
Mirus imports the additional attributes. You can select the attributes to view in the Attribute pane.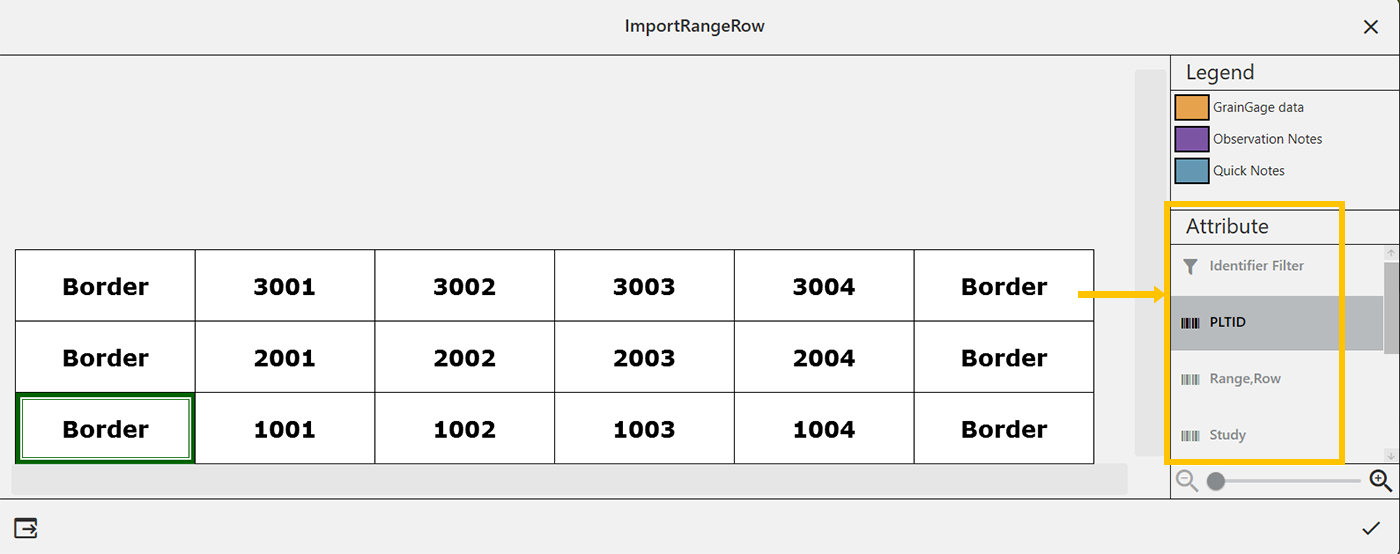
Import a Two-Dimensional (2D) Map
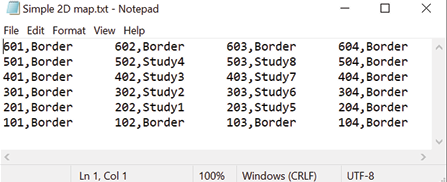
Two-dimensional (2D) maps have the same layout as the field. Plot IDs in a 2D map allow any plot name in any order to be used on the map. This type of map must be created with a spreadsheet or text editor and saved as a tab-delimited file or TXT file. Do not use any headings or spaces when creating a 2D map. Plot IDs may not contain any symbols.
Two-dimensional maps need to be in TXT format in order to be imported. The following is an importable 2D map file:
 To import a 2D map:
- Tap Maps.
- Tap New.
- Select Import Map from File.
- Navigate to and select the desired file.
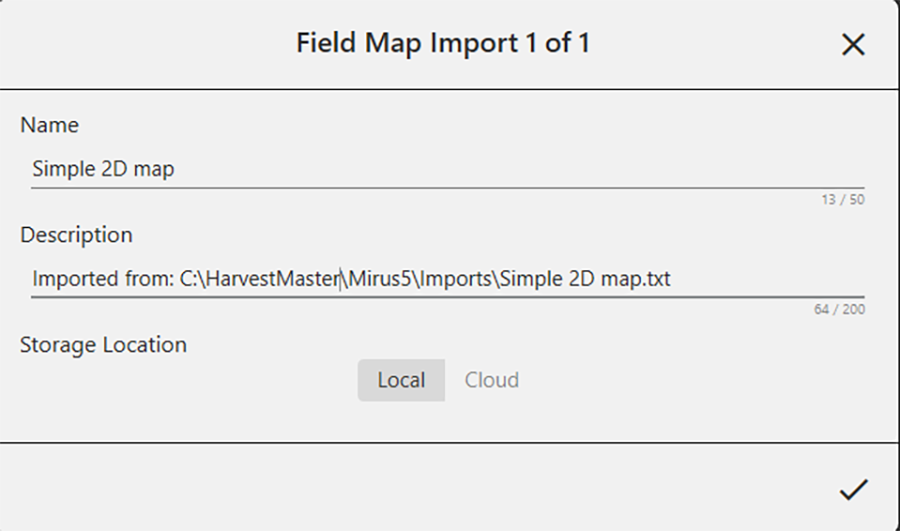
- If desired, change the default description displayed by Mirus.
- Tap .
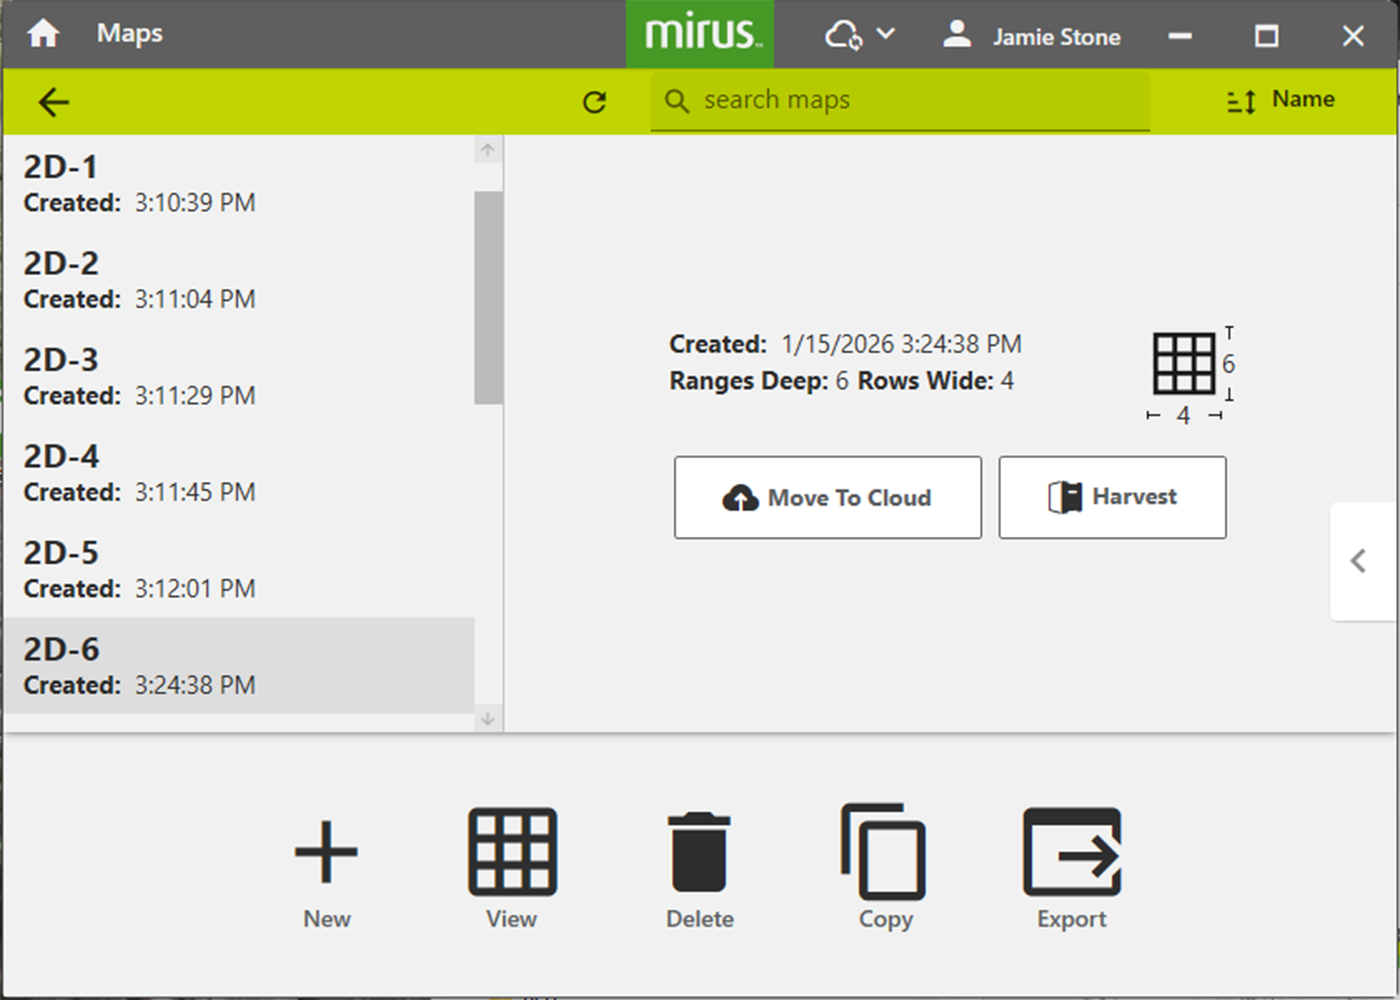
On the Manage Maps screen, Mirus displays a notification that the map has been imported successfully.
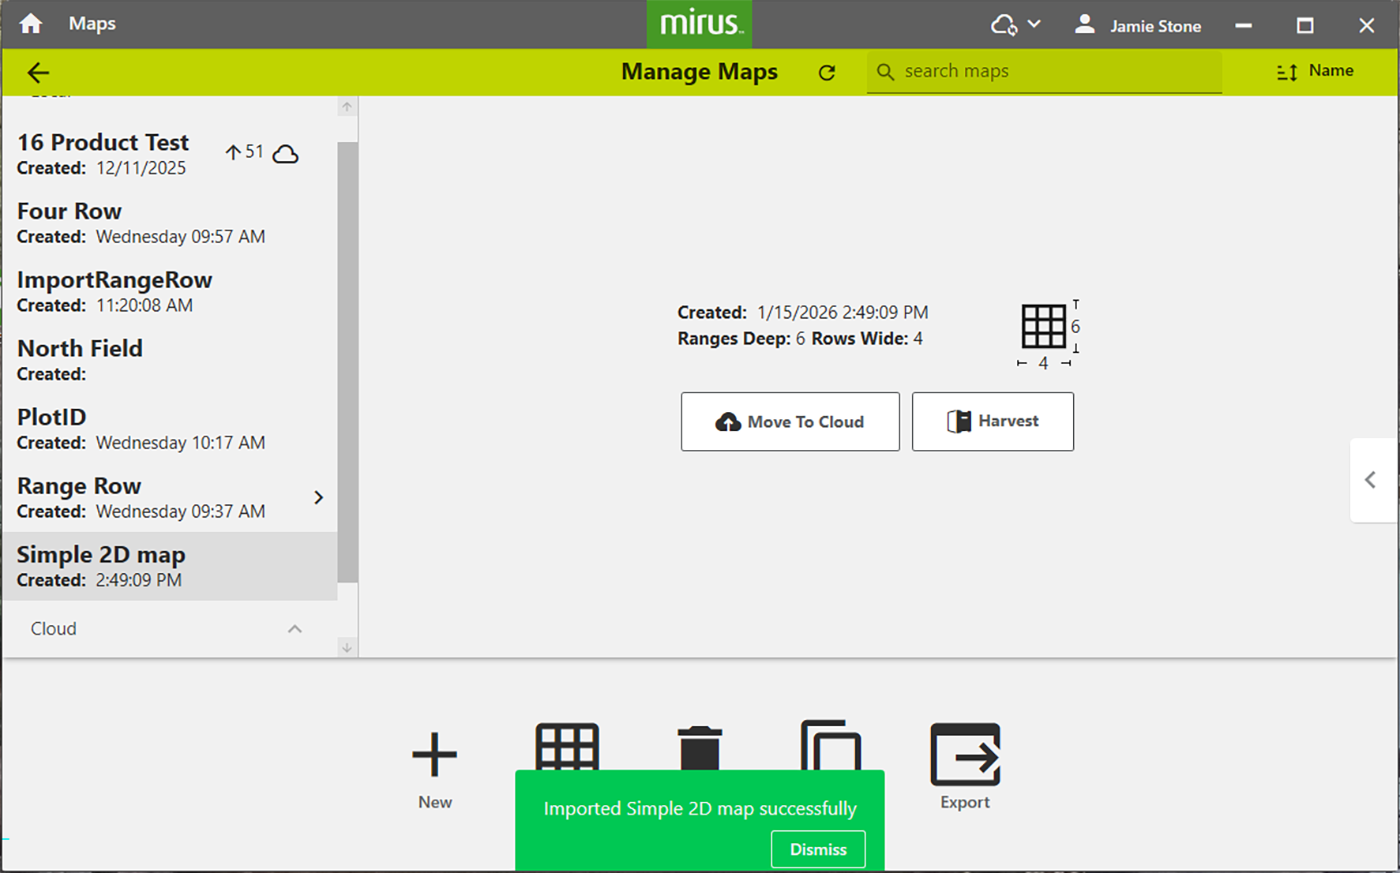
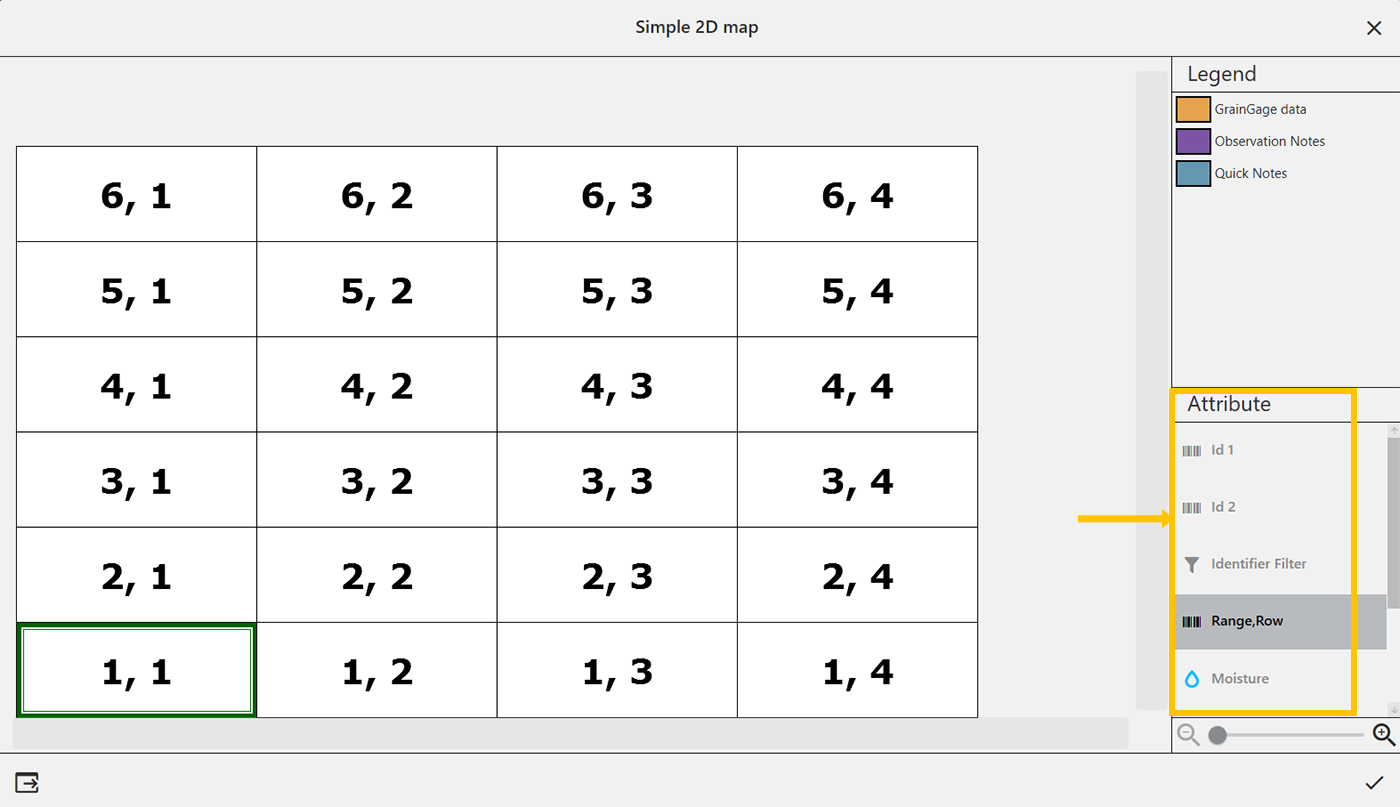
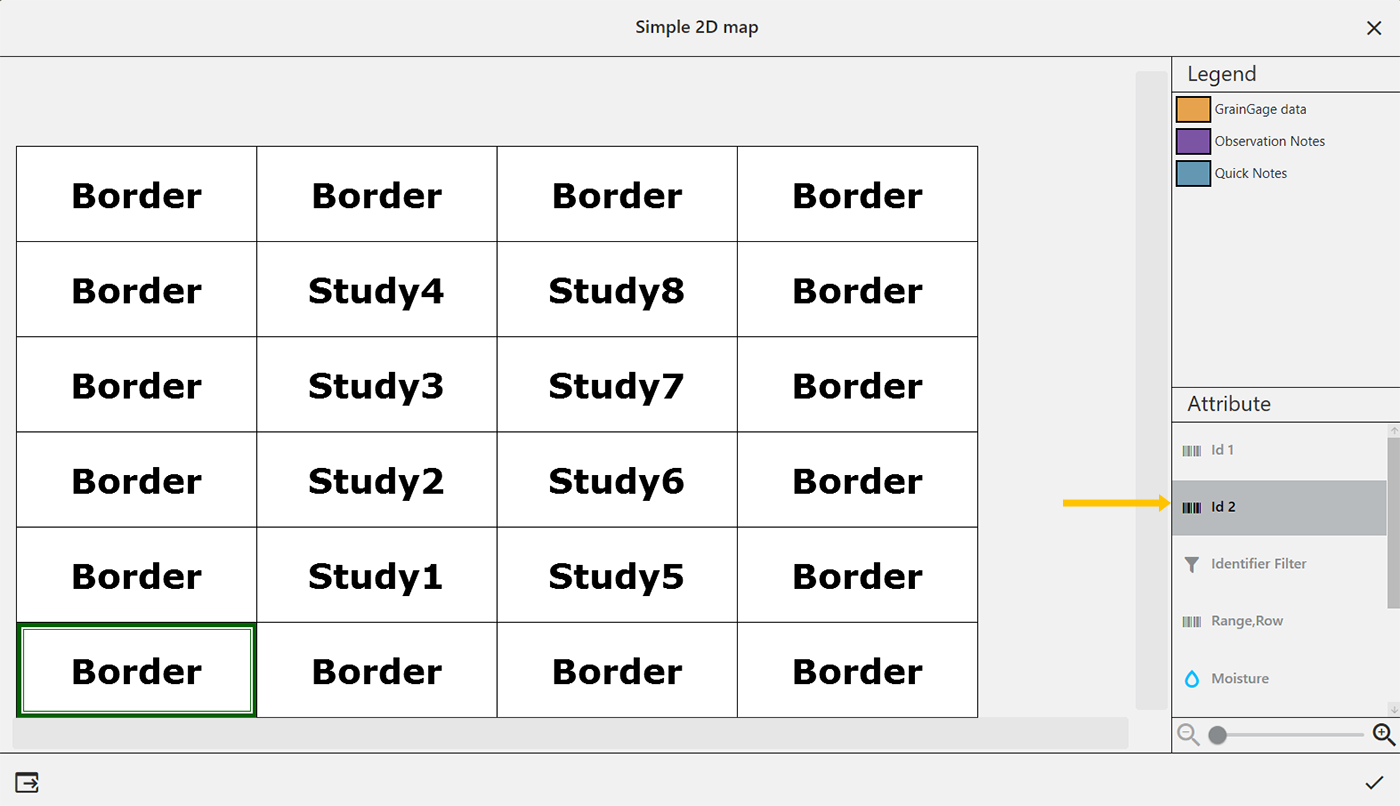
Mirus imports the additional attributes, but defaults to the Range,Row view. Select a different attribute to change the view.
Import Multiple Maps
It is possible to import multiple maps at the same time.
To import multiple maps:
- Tap Maps.
- Tap New.
- Select Import Map from File.
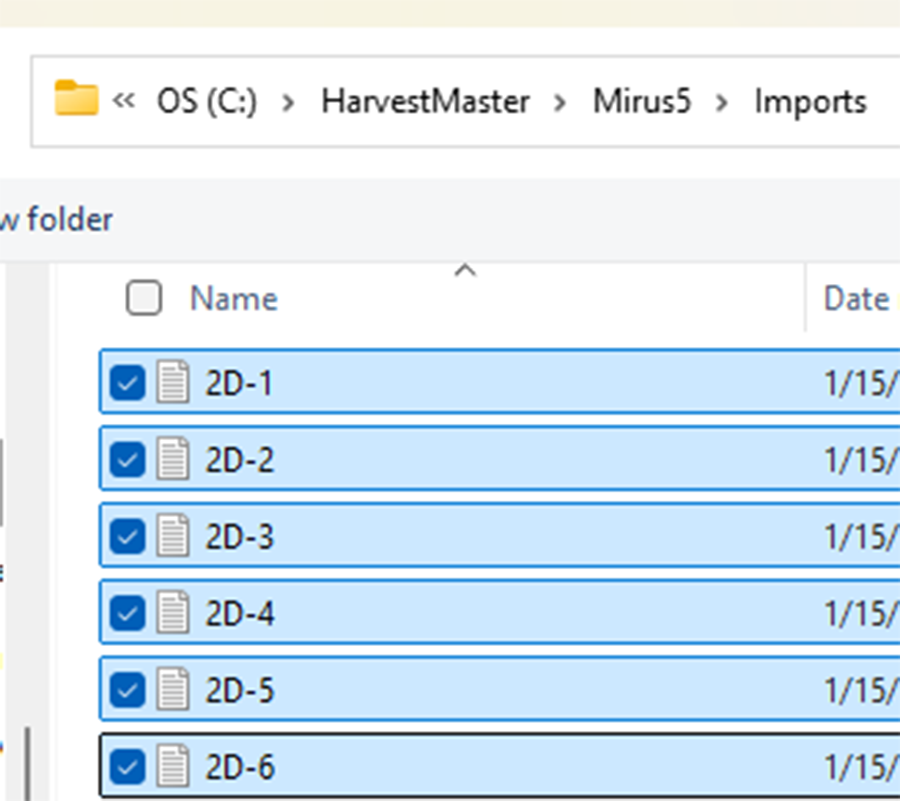
- Navigate to the desired files.
- Select the desired files and tap Open.
You can select multiple files by holding the Ctrl key and marking each file you want to import.
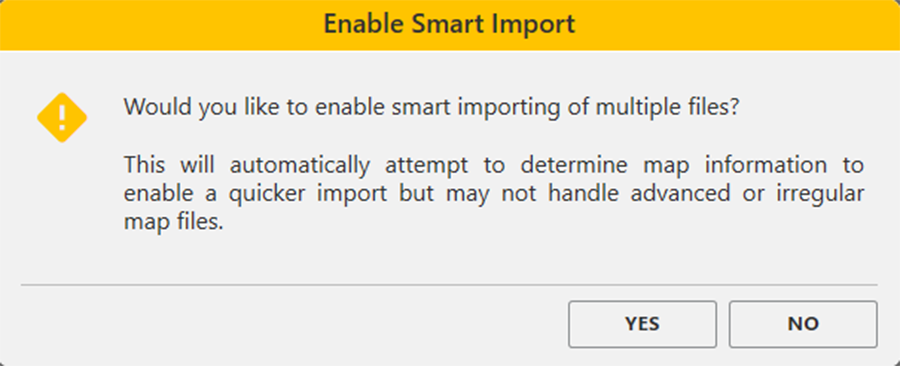
- Tap Yes to enable Smart Import.
Smart Import will import each file automatically without any additional input. If the map name already exists, the import will stop to allow the user to change the name.
Mirus gives you the chance to adjust the name, description, and storage location for each map to import.
- Tap to save the map.
Mirus displays a notification that the map was imported successfully.
The imported maps are displayed on the Manage Maps screen.
View a Map
Open the Manage Maps screen:
- Select the map you want to view.
- Tap View.
Mirus opens the map. The image below displays a map that has been partially harvested. Tap ![]() to close the map.
to close the map.
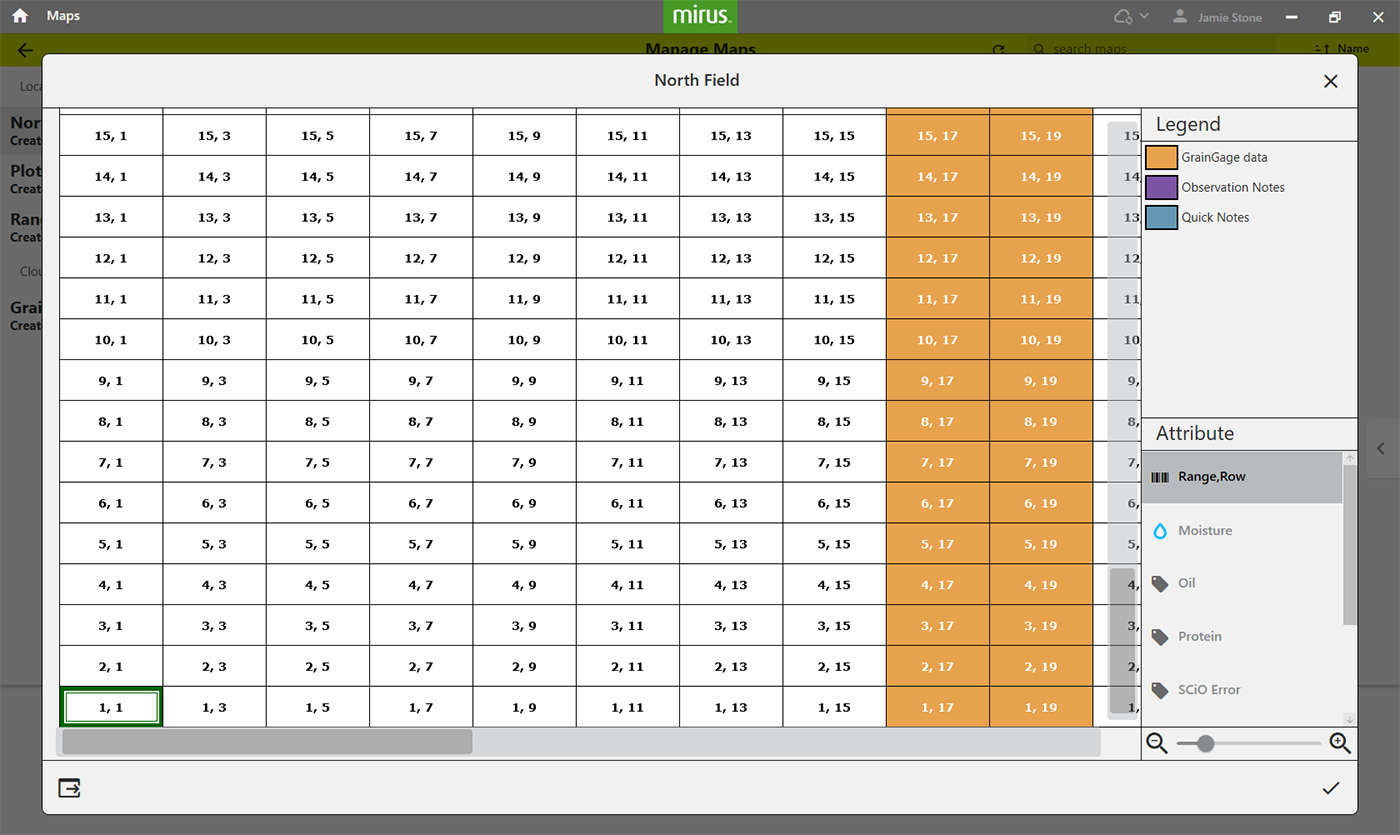
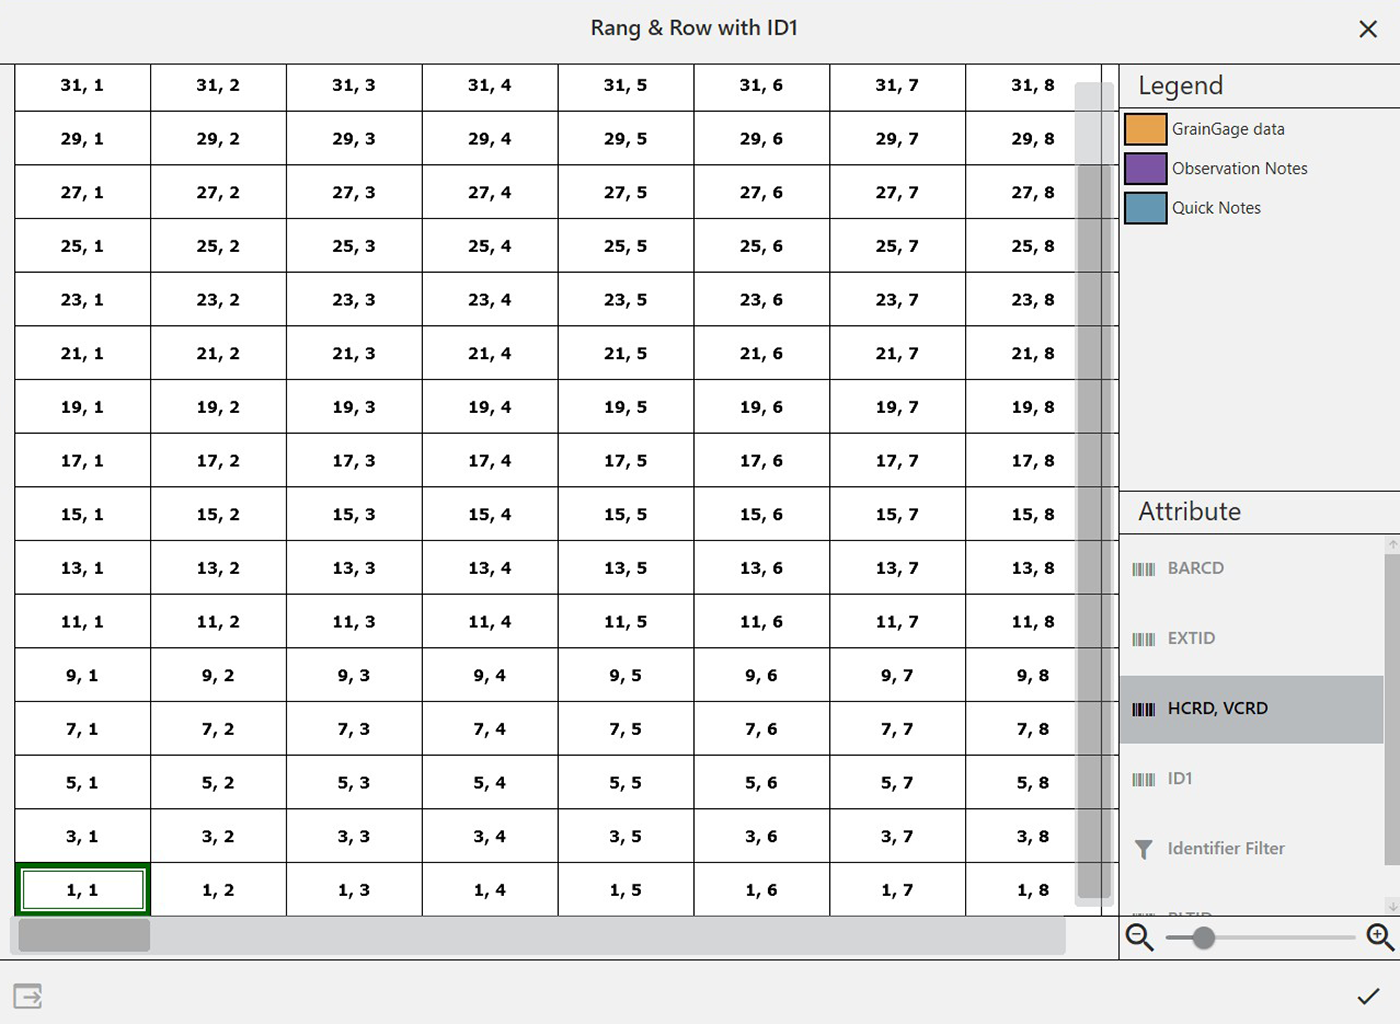
Depending on the attributes in the map and what data has been collected, Map View can be configured to display different attributes of the grain as shown in the image below.
Delete a Map
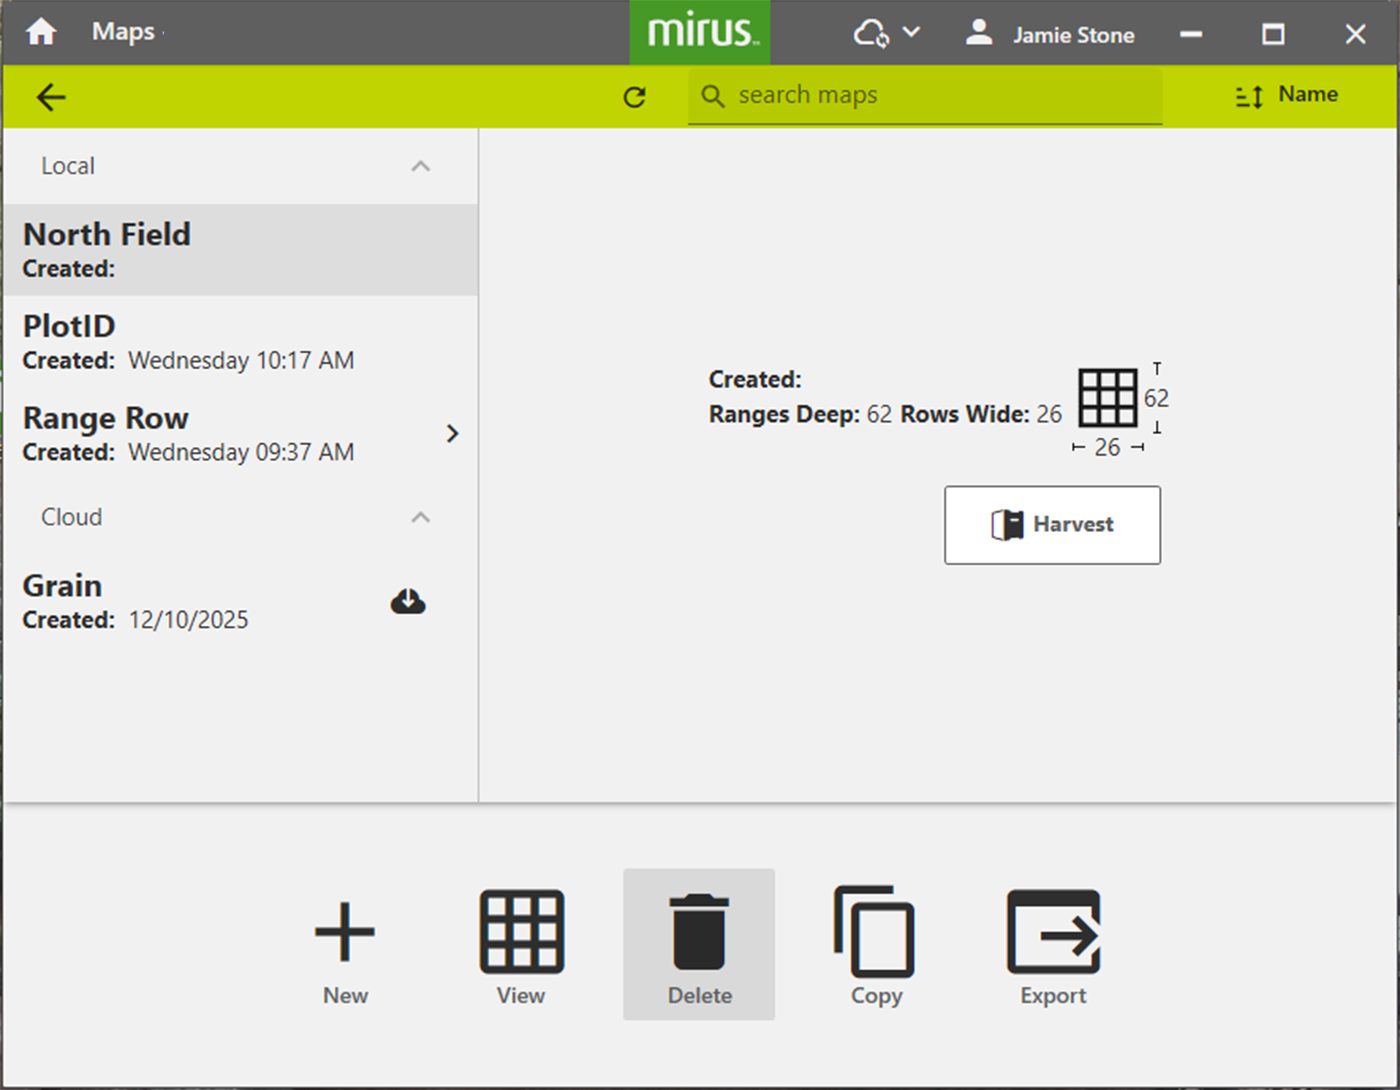
From the Manage Maps screen:
- Select the map you want to delete.
To delete multiple maps, long press/right click and select all of the maps you want to delete.
- Tap Delete.
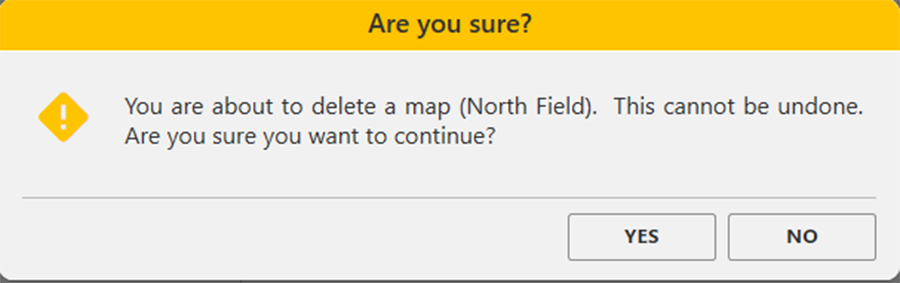
Mirus asks if you are sure.This cannot be undone! You cannot recover a deleted map.
- If you choose to proceed, tap Yes.
Mirus deletes the map, and it is no longer available in the list on the Manage Maps screen.
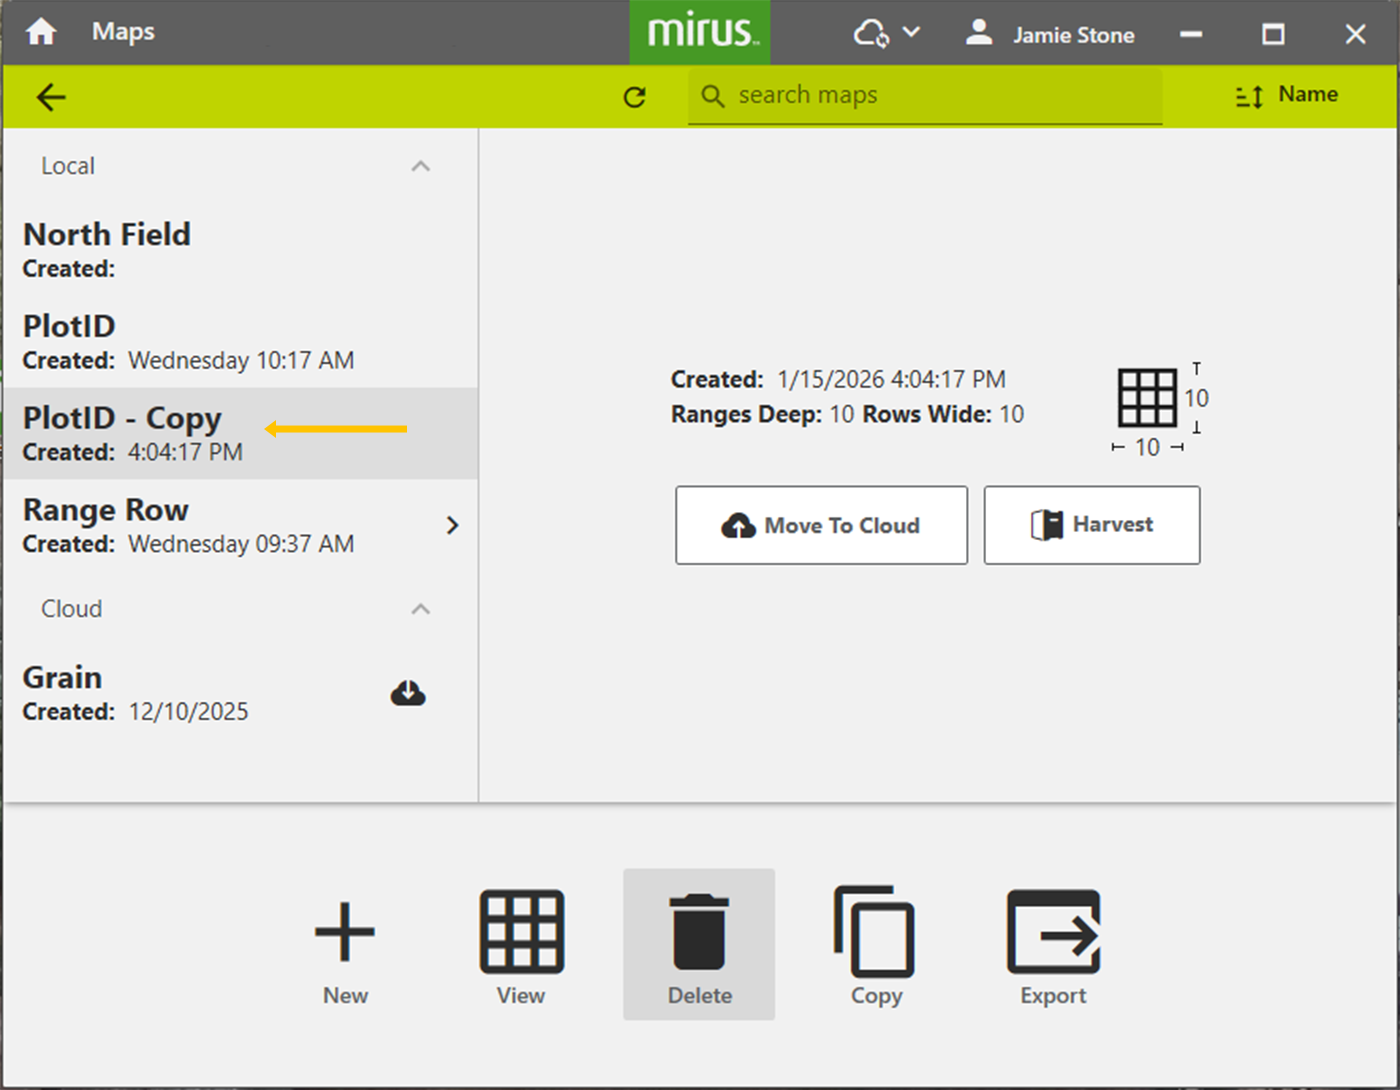
Copy a Map
Maps can be reused from year to year. To do so, simply copy the map in Mirus.
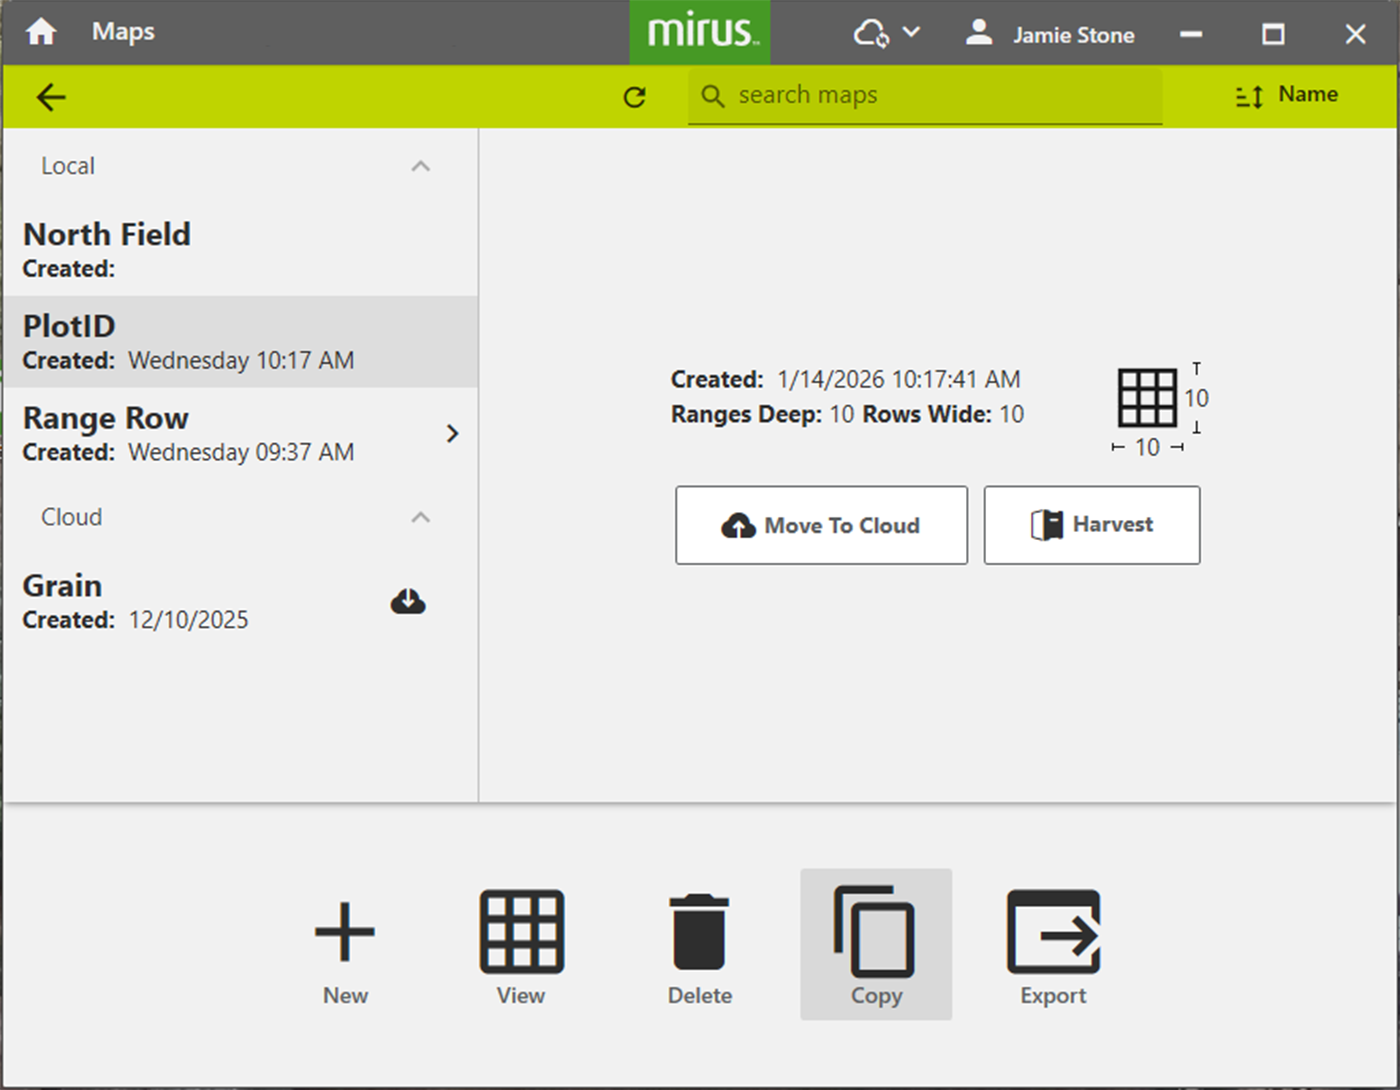
From the Manage Maps screen:
- Select the map you want to copy.
- Tap Copy.
This option will only copy the layout of the map. The data within the map will not be copied.
- Enter the name and description of the map.
- Tap to save the new copy.
Mirus adds it to the list of maps on the Manage Maps screen.
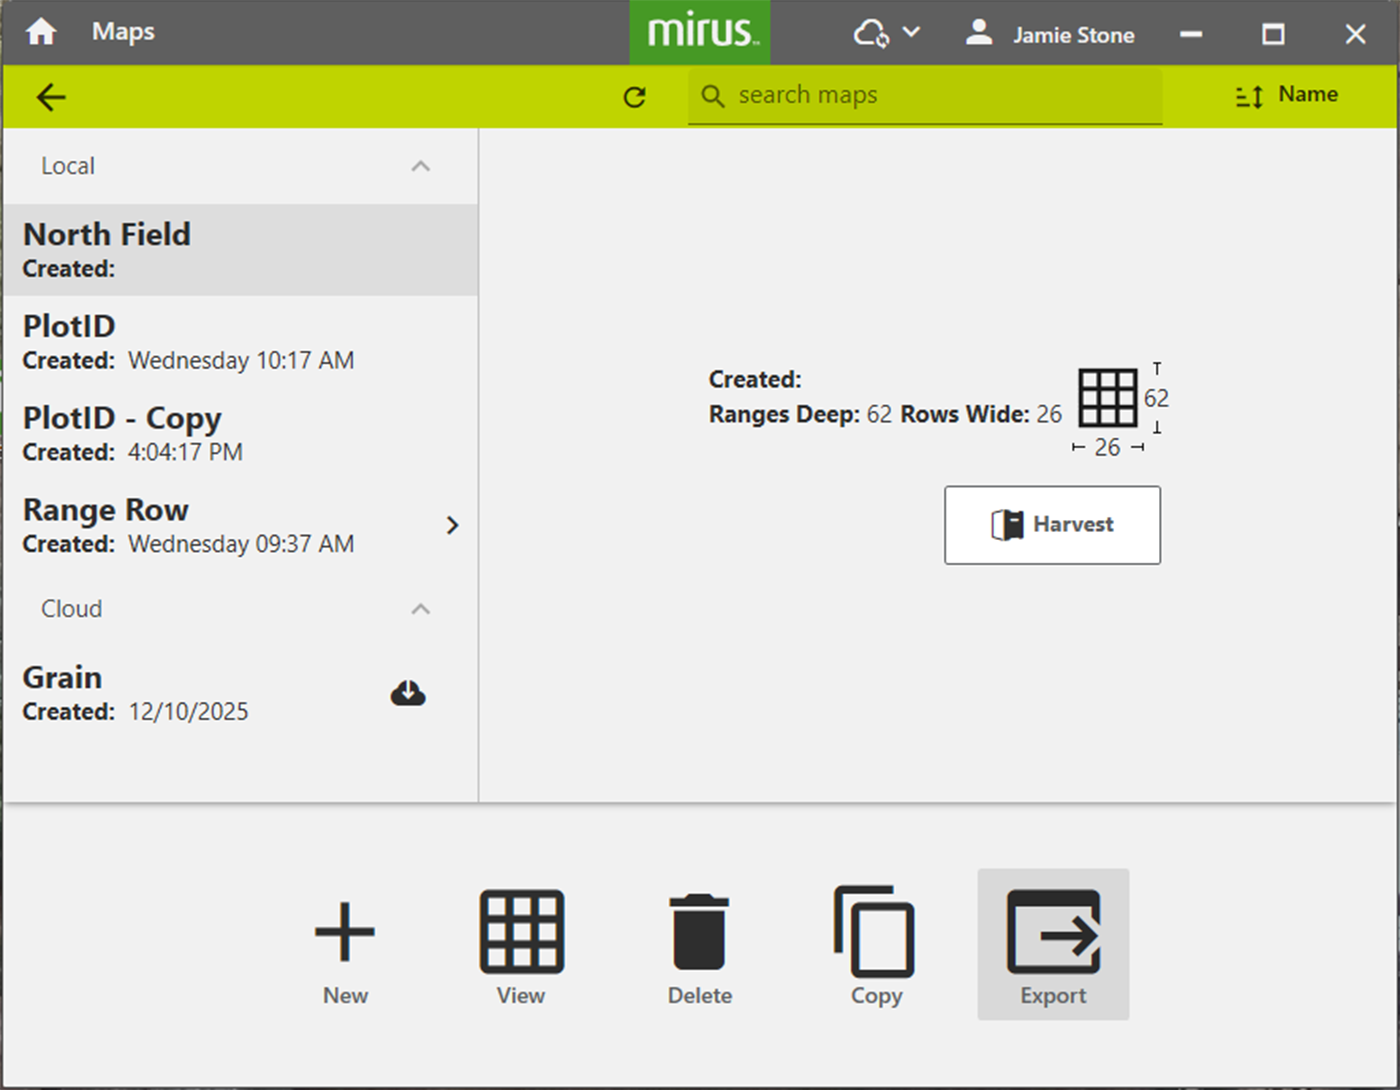
Export Map Data
The Manage Maps screen allows you to export maps as data and as heat maps. The export data option creates a detailed spreadsheet of your data. The heat map option creates a color-coded visual map (in a spreadsheet) of the parameters you set for each color.
From the Manage Maps screen:
- Select the map from which you want to export data.
To export multiple maps, hold down the Shift key and select the desired maps.
- Tap Export.
- Enter the file path for the exported data.
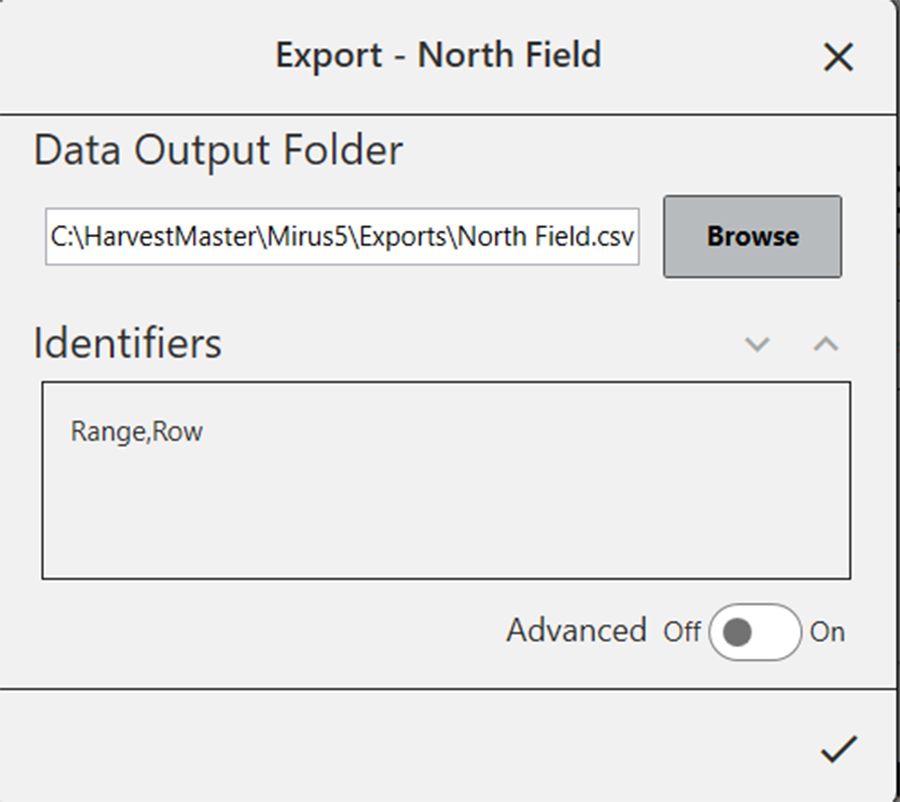
- When Advanced is switched to Off, Mirus automatically exports the data for weight, test weight, and moisture.
- When Advanced is switched to On, Mirus displays a list of available traits to export with the data.
- (optional) Select the individual traits you would like to export.
- Check Select All to export all the listed traits.
- Select Include Cycle Data to include sub-cycle and weight trip data.
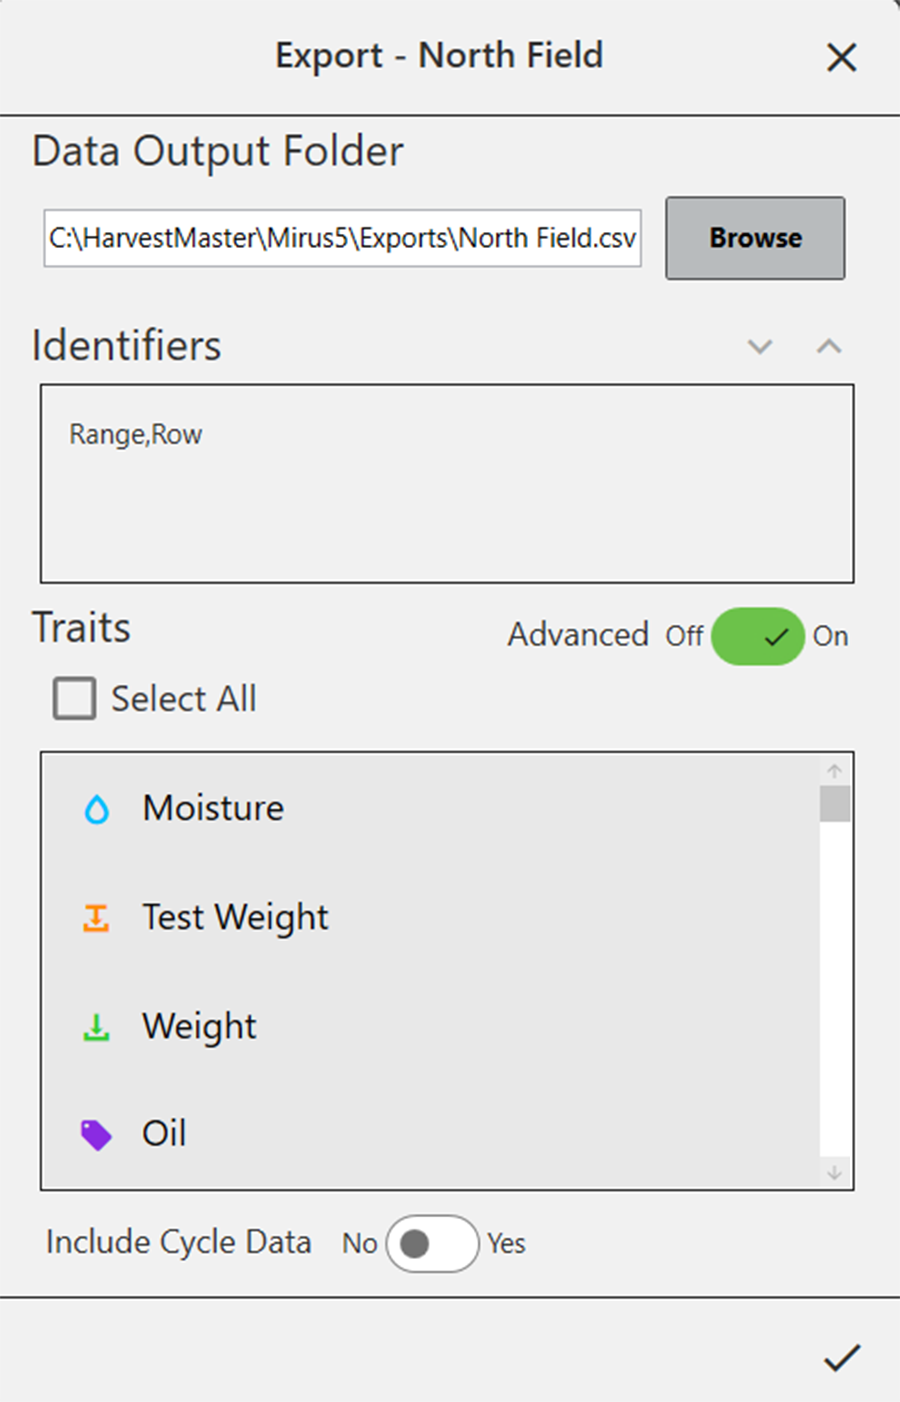
- Tap to finish exporting the data.
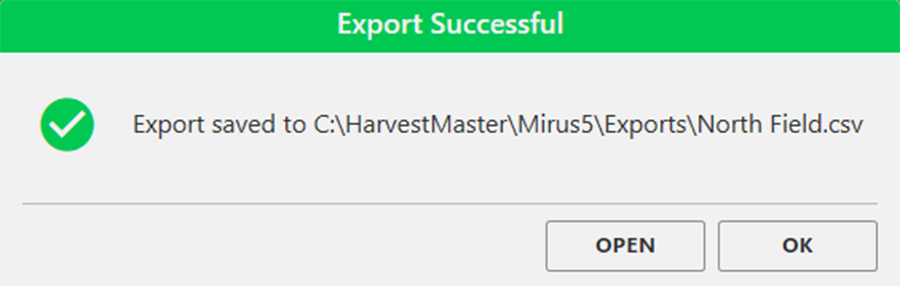
- Mirus notifies of the successful export.
- Tap OK to finish the export.
- Tap Open to finish the export, and open the CSV file.
Mirus exports the data into CSV (comma delimited) form. This allows you to import the data into other programs for analysis.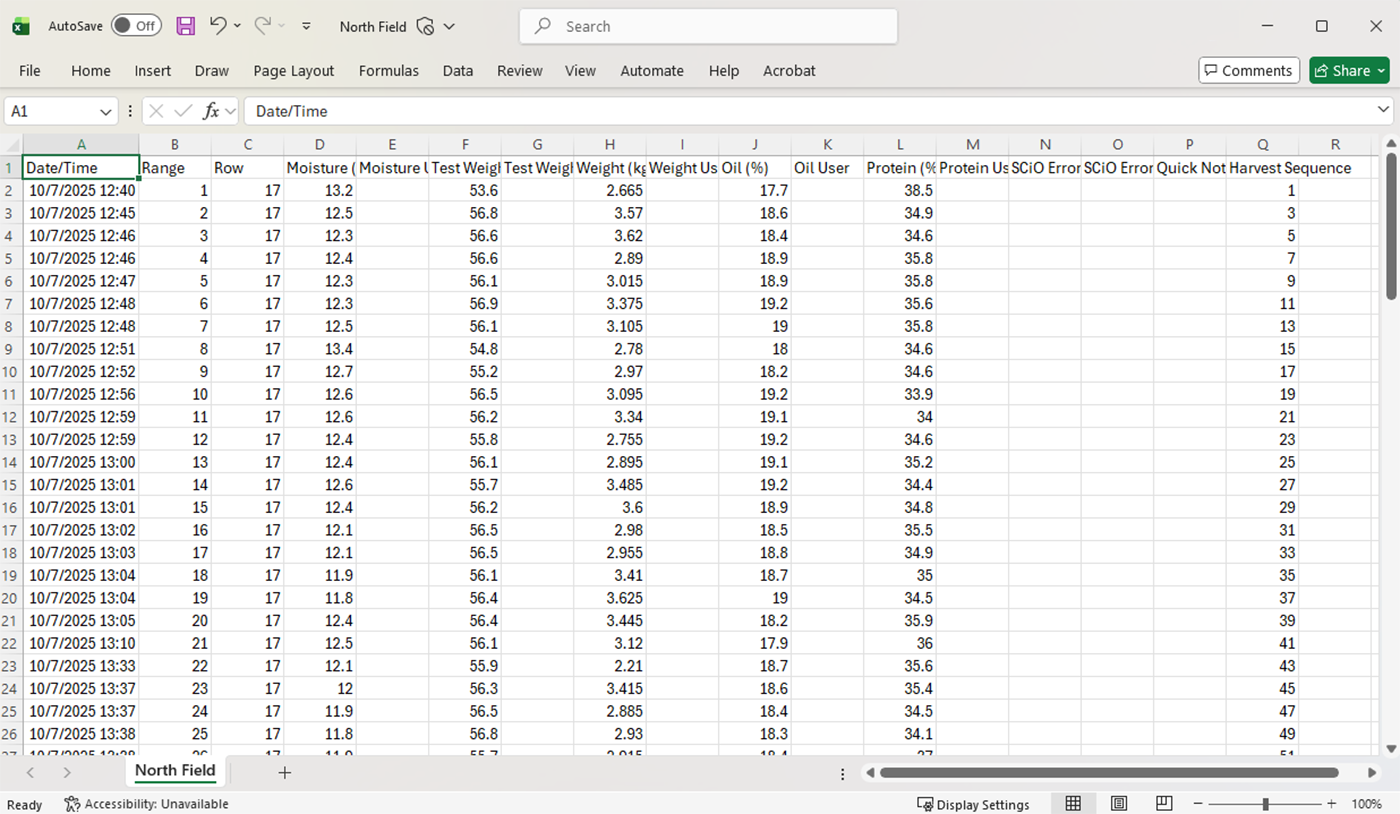
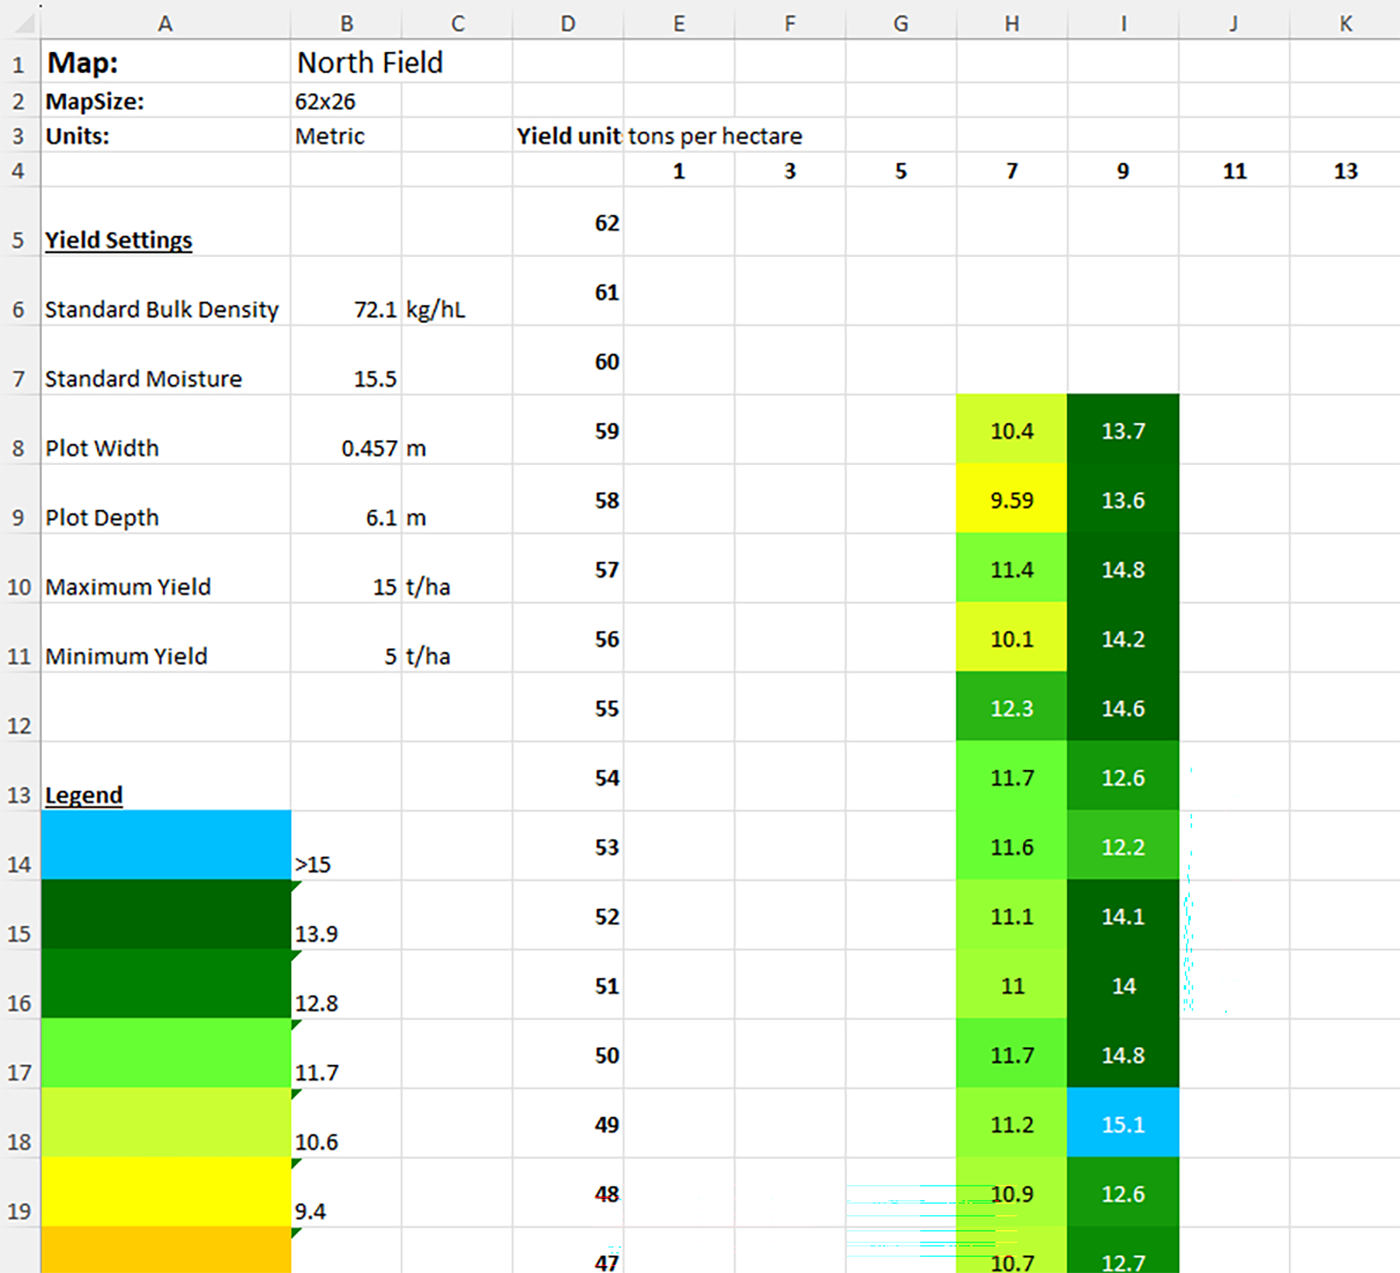
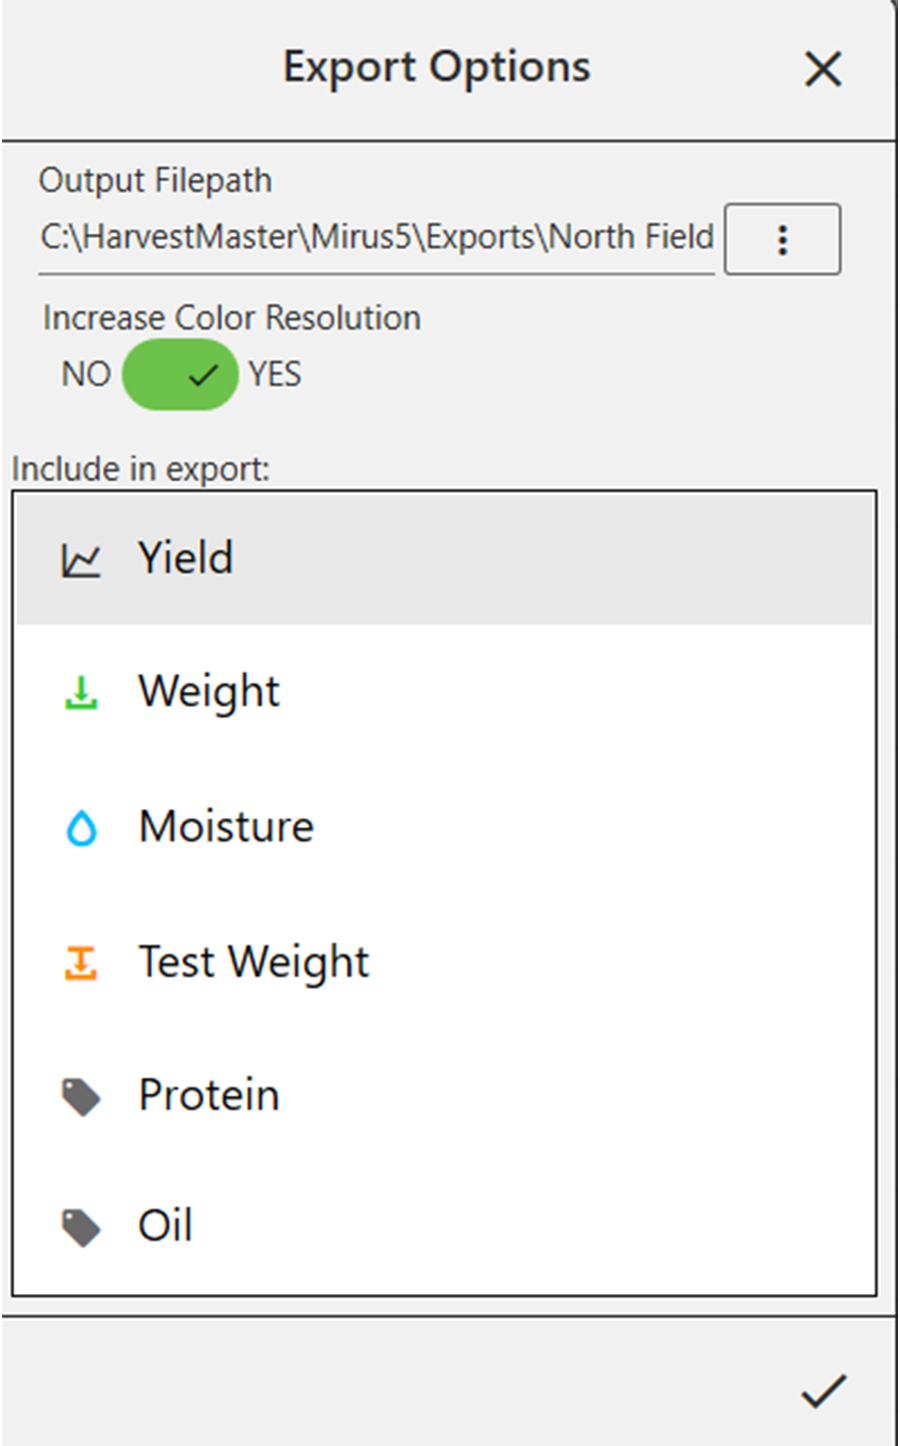
Export a Heat Map
Exporting a heat map creates a color-coded visual map in a spreadsheet for each desired attribute. The colors in the heat map are determined by the Legend. It can be altered by changing the minimum and maximum for each attribute. For instructions, see the following sections: Configure Weight in Spatial View, Configure Moisture in Spatial View, Configure Test Weight in Spatial View, and Configure Plot Size and Yield in Spatial View.
To export a heat map:
- Select the map you want to export from the Manage Maps screen.
- Tap View.
- Tap
 in the lower left corner.
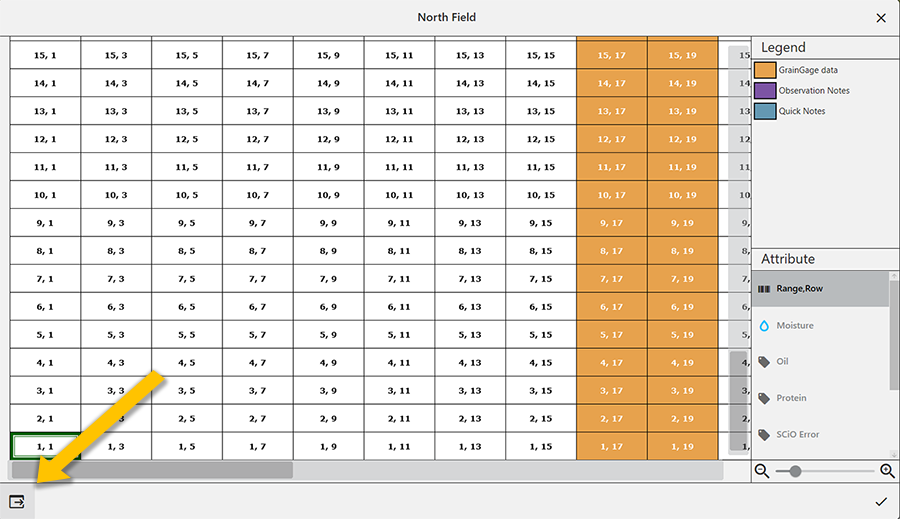
- Verify the file path for the exported map. Use
 to change the location.
 - Select what you want to include in the export.
If you select multiple attributes, each attribute will be displayed in a separate tab within Excel.
- Tap to export the map.
- Tap OK.
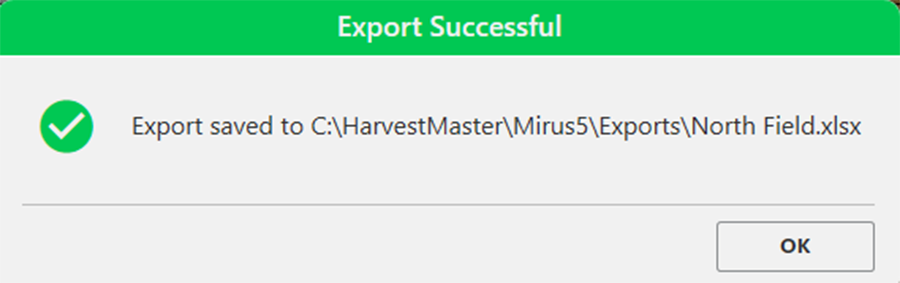
If Microsoft Excel is installed, a spreadsheet opens automatically, showing the exported heat map for each attribute in the map file.