Field Maps
This section explains how to create Range Row maps and Standard Plot ID maps.
Create a Range Row Field Map
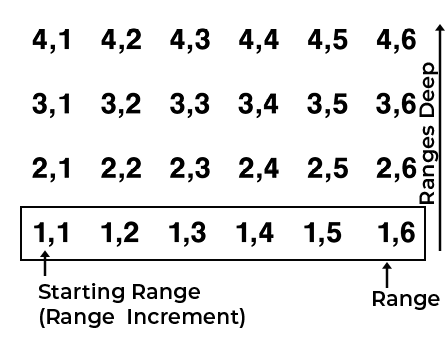
In a Range Row field map,
- Ranges deep indicates the number of ranges within a given field.
- Range increment is the numeric interval between ranges. This will usually be 1.
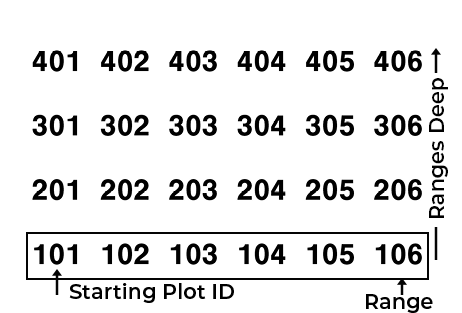
Range numbering begins with the bottom left corner of a field and proceeds upward.
In the example to the left,
- Starting Range is 1
- Range increment is 1
- Field is four ranges deep
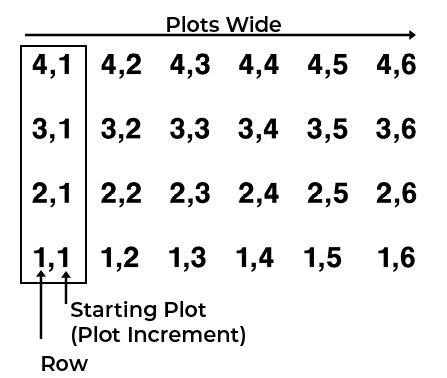
Row indicates a vertical group of plots.
- Plots wide indicates the number of plots within a given range.
- Plot increment is the numeric interval between plots. This will usually be 1.
Plot numbering begins in the bottom left corner of a field and proceeds right.
In the example to the left,
- Starting plot is 1
- Plot increment is 1
- Field map is six rows (plots) wide
The following instructions walk you through creation of a Range Row map.
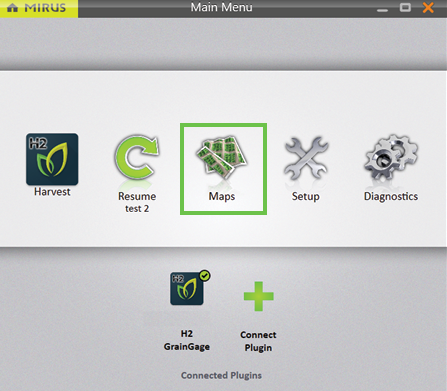
On the Mirus Home screen,
- Tap Maps
 .
.
.png)
- Tap New.
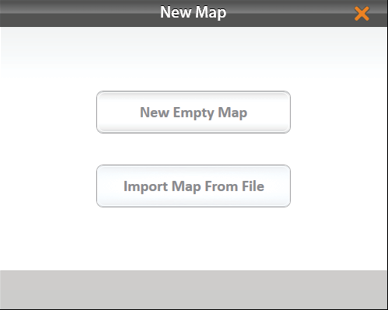
- Select New Empty Map.
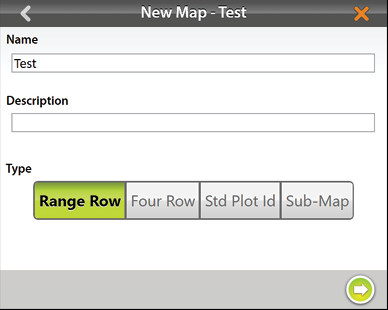
- Name and describe the map.
- Tap Range Row.
Note: The Four Row option only applies to Twin plot systems. - Tap the next arrow
 .
.
Note: The Name box will only accept basic letters and numbers. Do not use emojis or the following special characters: > < : ” \ ? | / *
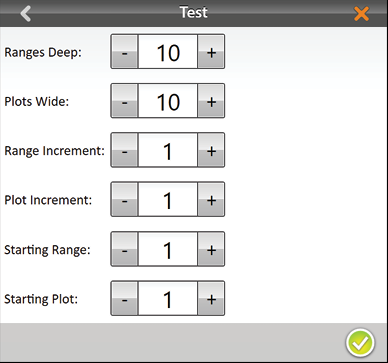
- Set the following:
- Ranges deep
- Plots wide
- Range increment
- Plot increment
- Starting range
- Starting plot
- Tap the check icon
 to save the map.
.png)
Mirus displays a description of the map on the Manage Maps screen. From this screen, Mirus allows you to do the following with your maps:
- Create new
- View
- Delete
- Copy
- Export
You also have the option to begin or resume harvest.
Create a Standard Plot ID Map
A Standard Plot ID map gives a unique ID number to each individual plot. The number of Ranges and Rows can reach up to 999. However, the display number can reach up to five digits, depending on how you choose to number the plots.
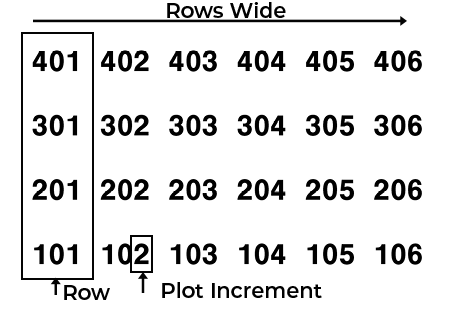
In a Standard Plot ID map,
- Range indicates a horizontal group of plots.
- Ranges deep indicates the number of ranges within a given field.
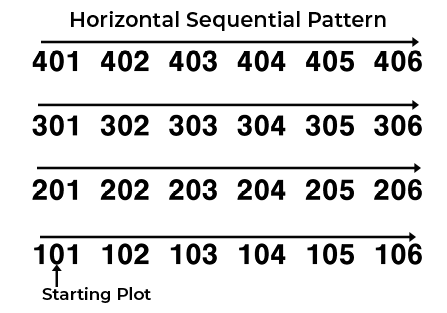
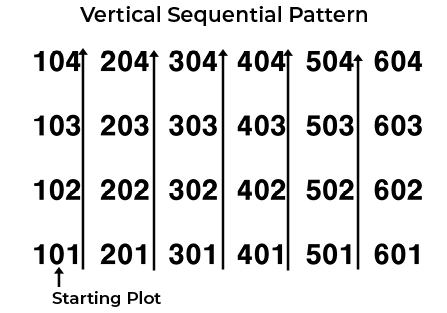
Plot numbering begins in the bottom left corner of a field.
In the example below,
- Starting plot is 101
- Field map is four ranges deep
- Row indicates a vertical group of plots.
- Rows wideindicates the number of rows within a given field.
Note: One plot wide is equal to one row even if you have multiple crop rows in a plot. - Plot increment is the numeric interval between plots. This will usually be 1.
In the example below,
- Plot increment is 1
- Field map is six rows (plots) wide
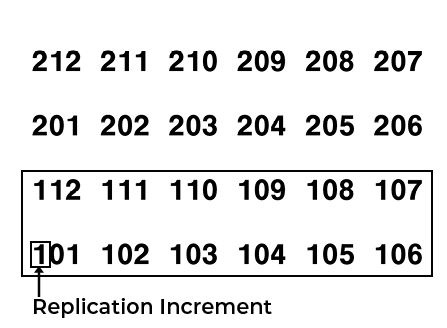
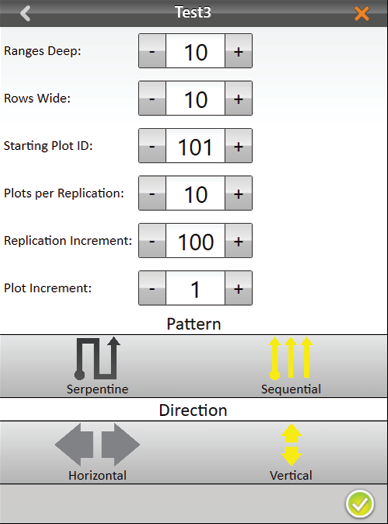
- Reps (or Replication) usually indicates the same horizontal group of plots in a particular range as in the above examples. However, in some cases a replication will extend beyond a range (left).
- Plots per replication indicates the number of plots in each replication.
- Replication increment is the numeric interval between the first plots in each replication (e.g., 100 or 1000).
In the example below,
- Replication increment is 100
- Field map is six rows (plots) wide
- Plots per replication is 12
- Pattern indicates the layout sequence for the plot increments.
- Serpentine pattern numbers the plots in a back and forth pattern across the field. The back and forth pattern can be either horizontal or vertical.
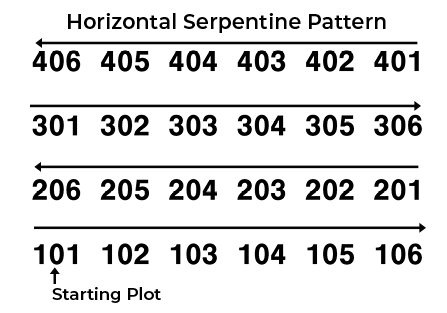
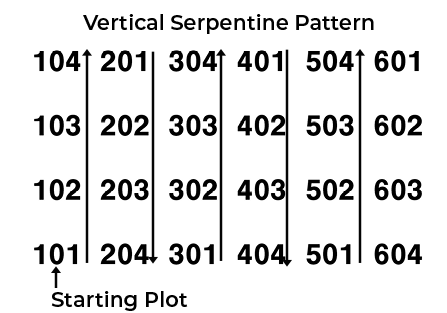
- Sequential pattern numbers the plots in parallel columns. The columns can be ranges (horizontal) or rows (vertical).
- Direction indicates the direction in which plot increments increase.
Note: In order to collect the correct data, the map pattern and direction should follow the planted pattern. This may or may not correspond with your harvest pattern.
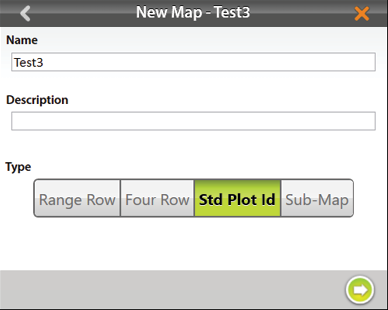
The following instructions walk you through creation of a Standard Plot ID map.
On the Mirus Home screen,
- Tap Maps .
- Tap New.
- Select New Empty Map.
- Name and describe the map.
- Tap Standard Plot ID.
- Tap the next arrow .
Note: The Name box will only accept basic letters and numbers. Do not use emojis or the following special characters: > < : ” \ ? | / *
- Set the following:
- Ranges deep
- Rows wide
- Starting plot ID
- Plots per replication
- Replication increment
- Plot increment
- Pattern
- Direction
- Tap the check icon to save the map.
Mirus displays a description of the map on the Manage Maps screen.
From this screen, Mirus allows you to do the following with your maps:
- Create new
- View
- Delete
- Copy
- Export
You also have the option to begin or resume harvest.
1.png)
Note: In Map View, Mirus initially displays Standard Plot ID maps as Range Row maps. To display the plot IDs, select Plot ID under Attribute.![]()
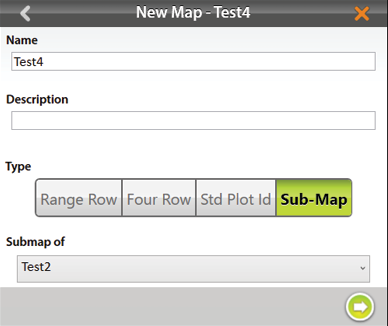
Create a Sub-Map
Mirus allows the creation of sub-maps—smaller divisions of the larger field maps.
To create a sub-map,
- Open the Manage Maps screen, and tap New.
- Select New Empty Map.
- Name and describe the map.
- Tap Sub-Map.
- Select which map this will be a sub-map of.
- Tap the next arrow
 .
.
Note: The Name box will only accept basic letters and numbers. Do not use emojis or the following special characters: > < : ” \ ? | / *
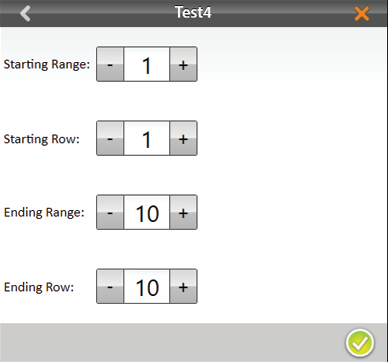
- The plot and range increments are the same as the larger field map. Set the following:
- Starting range
- Starting row
- Ending range
- Ending row
- Tap the check icon to save the map.
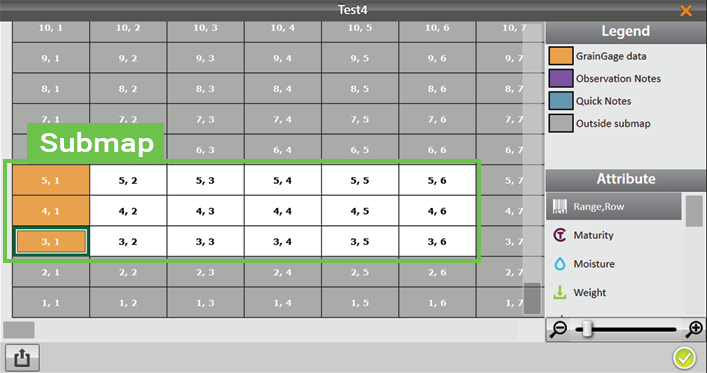
On the Manage Maps screen, Mirus displays the sub-map under the main field map it is a part of.
.png)
Import a Map
In Mirus you can easily import maps created in Microsoft Excel or research programs such as PRISM® and AGROBASE®. The imported field map information includes Range, Row, Rep, Pass, Pedigree, or other IDs. This can be done in Range Row and Two Dimensional (2D) formats. This section explains how to import Range Row and 2D maps.
Import a Range Row Map
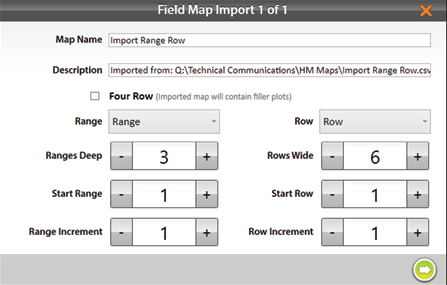
Range row maps need to be in CSV format in order to be imported. Following is an importable range row map file. Notice,
-
The Header row must include columns for range and row. Additional columns are optional.
-
If you will be harvesting border plots, do not forget to include them in your map.
-
The main benefit of importing maps is that you can include more data and identifiers (in addition to range and row) for each plot. In the example below notice the columns PLTID and study.
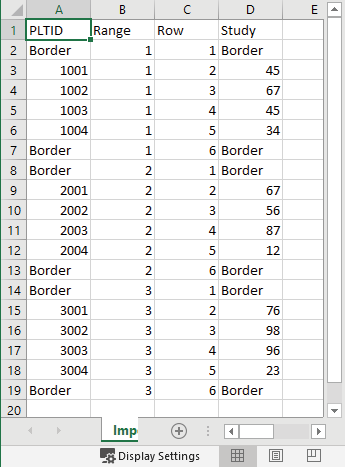

Note: The range row map is in list format, and the range and row columns are entirely numeric. The column names are unimportant. During the import process, Mirus allows you to select which of the entirely numeric columns are Range and Row.
Note: Only basic letters and numbers are accepted in the spreadsheet. Do not use emojis or the following special characters: > < : ” \ ? | / *
The following instructions walk you through importing a Range Row map. On the Mirus Home screen,
- Tap Maps .
- Tap New.
- Select Import Map from File.
- Navigate to and select the desired file.
- Check the values displayed by Mirus and make sure they reflect the map you are importing. If necessary, change the columns designated as Range and Row by clicking on their respective drop-down menus.
Tap the drop-down menus to display other options for the range and row columns.
- Tap the next arrow .
On the Manage Maps screen, Mirus displays a notification that the map has been imported successfully.
.png)
Mirus imports the additional attributes. You can select the attributes to view in the Attribute pane.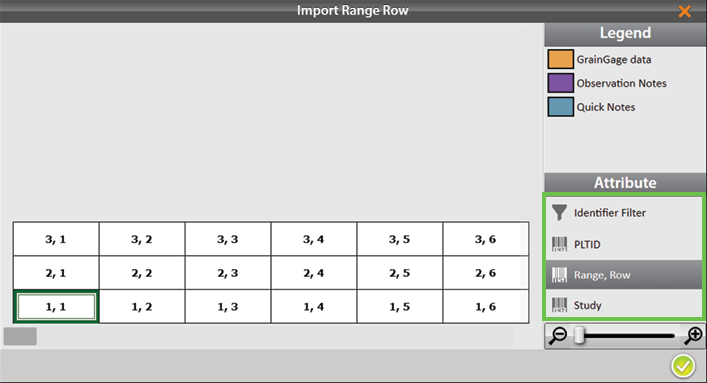
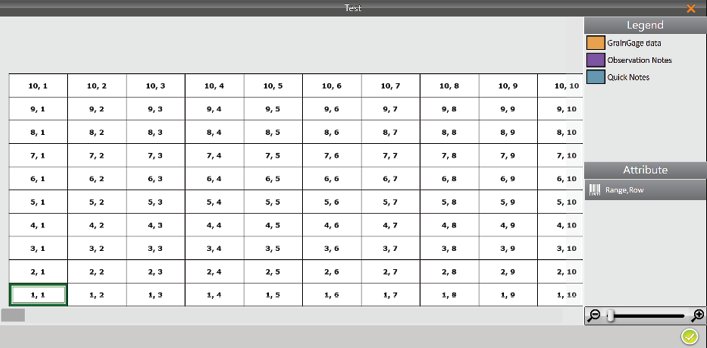
Import a Two-Dimensional (2D) Map
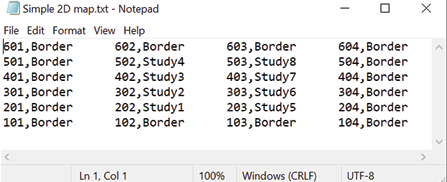
Two-dimensional (2D) maps have the same layout as the field. Plot IDs in a 2D map allow any plot name in any order to be used on the map. This type of map must be created with a spreadsheet or text editor and saved as a tab-delimited file or TXT file. Do not use any headings or spaces when creating a 2D map. Plot IDs may not contain any symbols.
Two-dimensional maps need to be in TXT format in order to be imported. The following is an importable 2D map file:
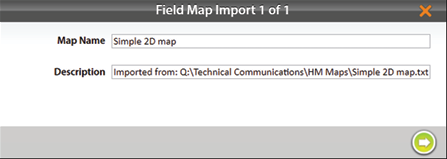
The following instructions walk you through importing a 2D map. On the Mirus Home screen,
- Tap Maps .
- Tap New.
- Select Import Map from File.
- Navigate to and select the desired file.
- If desired, change the default description displayed by Mirus.
- Tap the next arrow .
On the Manage Maps screen, Mirus displays a notification that the map has been imported successfully.
Mirus imports the additional attributes. Select a different attribute to change the view. 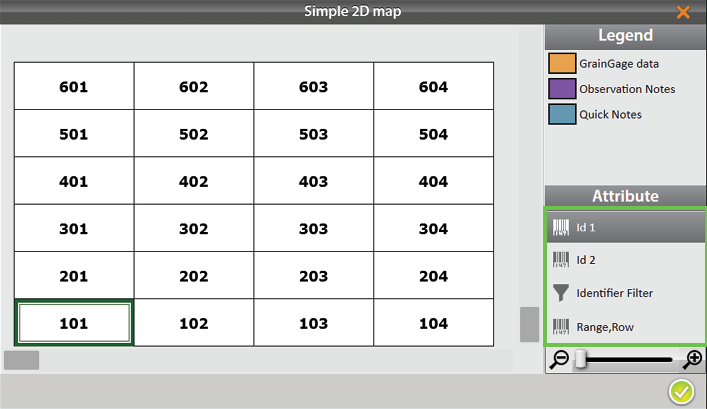
Import Multiple Maps
It is possible to import multiple maps at the same time.
On the Miurs Home screen,
- Tap Maps .
- Tap New.
- Select Import Map from File.
- Navigate to the desired files.
- Select the desired files and tap Open.
Note: You can select multiple files by holding the CTRL key and marking each file you want to import.
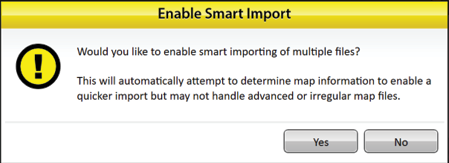
- Tap Yes to enable Smart Import.
Smart Import will import each file automatically without any additional input from the user. If the map name already exists, the import will stop to allow the user to change the name.
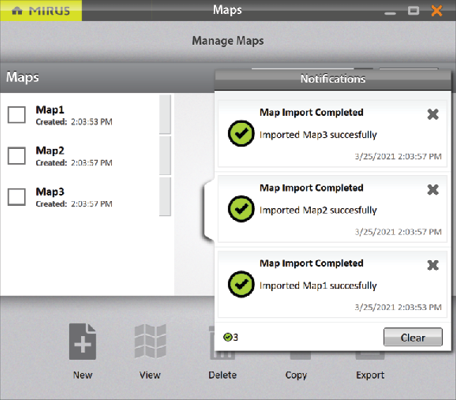
On the Manage Maps screen, Mirus displays a notification that the maps have been imported successfully.
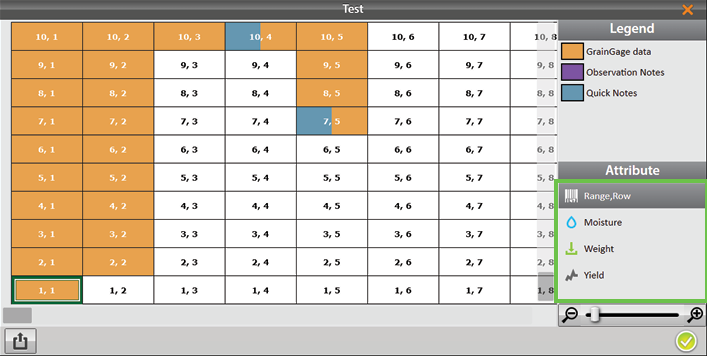
View a Map
Open the Manage Maps screen,
- Select the map you want to view.
- Tap View.
Mirus opens the Map View screen. The image below displays a map that has not yet been harvested:
Depending on the attributes in the map and what data has been collected, Map View can be configured to display different attributes of the grain as shown in the image below:
Delete a Map
On the Manage Maps screen,
- Select the map you want to delete.
- Tap Delete.
Mirus asks if you are sure.
![]() CAUTION: This cannot be undone! You cannot recover a deleted map.
CAUTION: This cannot be undone! You cannot recover a deleted map.
If you choose to proceed, tap Yes.
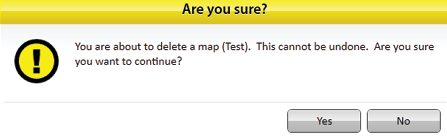
Mirus deletes the map, and it is no longer available in the list on the Manage Maps screen.
Copy a Map
Maps can be reused from year to year. To do so, simply copy the map in Mirus.
On the Manage Maps screen,
- Select the map you want to copy.
- Tap Copy.
Note: This option will only copy the layout of the map. The data within the map will not be copied.
-copy.png)
- Enter the name and description of the map.
- Tap the check icon to save the new copy.
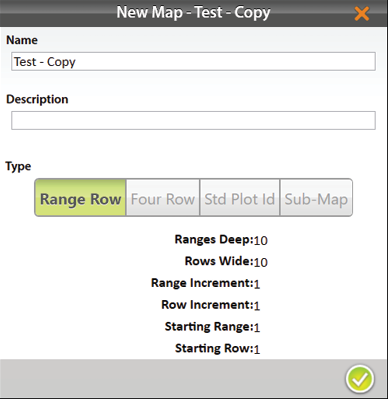
Mirus adds it to the list of maps on the Manage Maps screen.
Export Map Data
The Manage Maps screen allows you to export maps as data and as heat maps. The export data option creates a detailed spreadsheet of your data. The heat map option creates a color-coded visual map (in a spreadsheet) of the parameters you set for each color.
On the Manage Maps screen,
- Select the map from which you want to export data.
Note: To export multiple maps, hold down the Shift key and select the desired maps. - Tap Export.
-export.png)
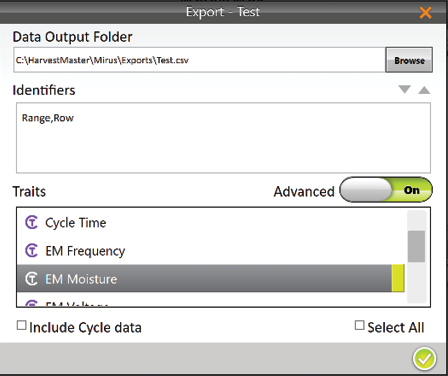
- Enter the file path for the exported data.
- Select your preferred Identifiers.
When Advanced is switched to Off, Mirus automatically exports the data for weight, test weight, and moisture.
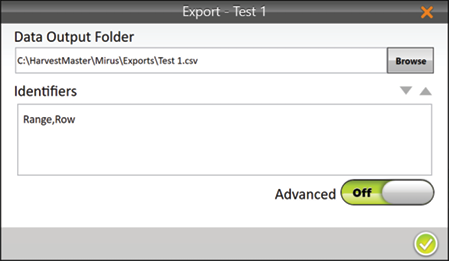
- When Advanced is switched to On, Mirus displays a list of available traits to export with the data.
- Select your preferred traits.
Note: If you check Include Cycle Data, the export will include sub-cycle and weight trip data.
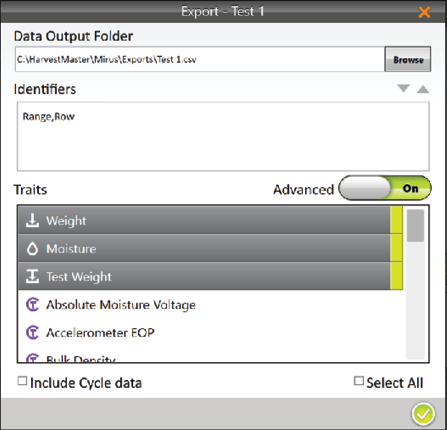
- Select the individual traits you would like to export. If needed, check Select All to export all the listed traits.
- Tap the check icon to finish exporting the data.
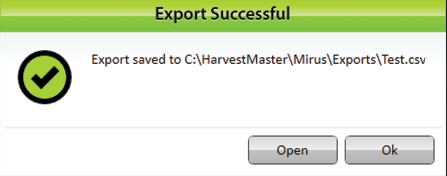
Mirus notifies of the successful export.
- Tap OK to finish the export.
- Tap Open to finish the export, and open the CSV file.
Mirus exports the data into CSV (comma delimited) form. This allows you to import the data into other programs for analysis.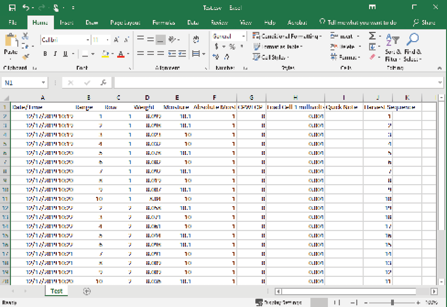
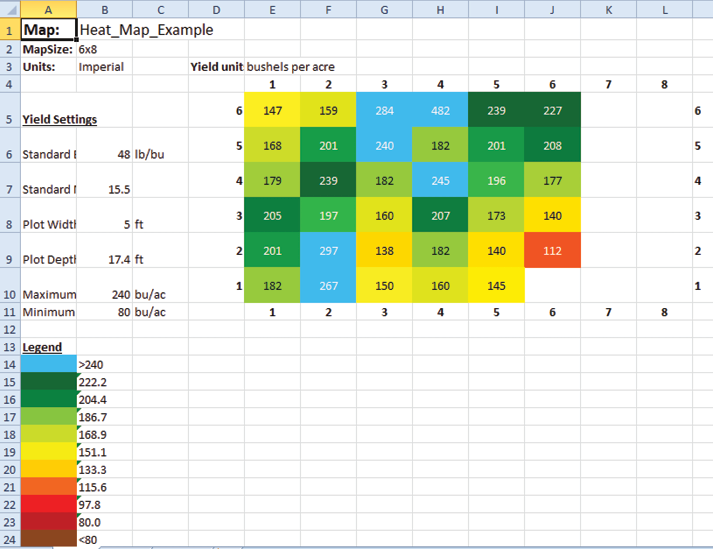
Export a Heat Map
Exporting a heat map creates a color-coded visual map in a spreadsheet for each desired attribute. The colors in the heat map are determined by the Legend. It can be altered by changing the minimum and maximum for each attribute. For instructions, see the following sections: Configure Weight in Spatial Display, Configure Moisture in Spatial Display, Configure Test Weight in Spatial Display, and Configure Plot Size and Yield in Spatial Display.
The following steps explain how to export a heat map.
On the Manage Maps screen,
- Select the map you want to export.
- Tap View.
- Tap Export
 .
.
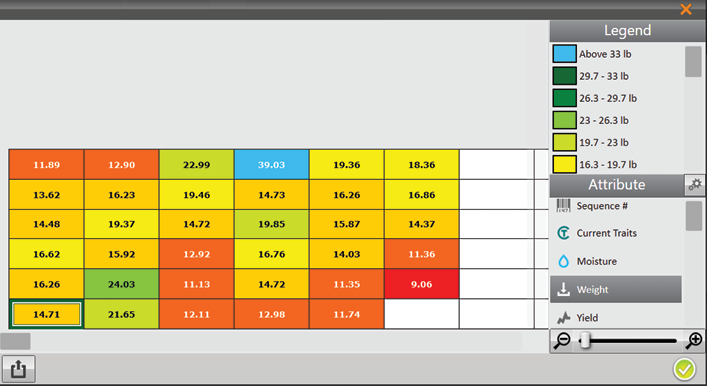
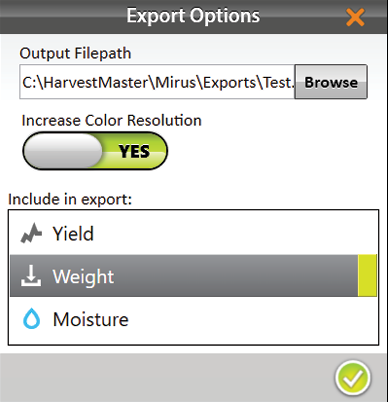
- Enter the file path for the exported map.
- Select whether you want to increase color resolution.
- Select the attributes you want included in the export.
Note: If you select multiple attributes, each attribute will be displayed in a separate tab within Excel. - Tap the check icon to finish exporting the map.
Mirus notifies of the successful export.
- Tap OK to finish the export.
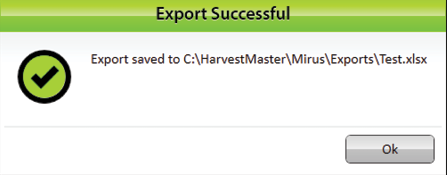
If Microsoft Excel is installed, a spreadsheet opens automatically, showing the exported heat map.