Harvest Mode
Options for Opening Harvest Mode
You must create or import a map before you can harvest. Mirus offers three different routes for initiating or re-entering Harvest Mode.
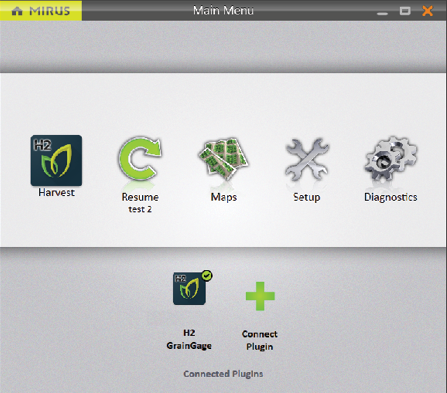
On the Mirus Home screen,
- Tap Harvest
 . Mirus asks you to select from a list of previously created maps for this harvest.
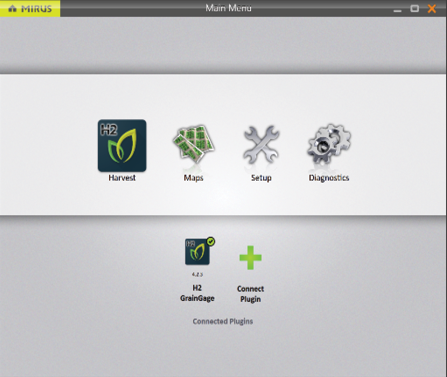
Note: If the Harvest icon is not visible, see Connect to the GrainGage Plugin for instructions on loading the H2 or H3 GrainGage plugin.
Or
- Tap Maps
 . Mirus opens the Manage Maps screen. From there, select a map and tap Harvest.
Or
- Tap Resume
 . Mirus resumes harvest in the last map used (including the direction, navigation type, and moisture curve).
If you have already begun to harvest a particular map, Mirus displays that map name below the Resume icon.
Open Harvest Mode
This section describes the first option for opening Harvest Mode.
On the Mirus Home screen,
- Tap Harvest
 .
.
Or
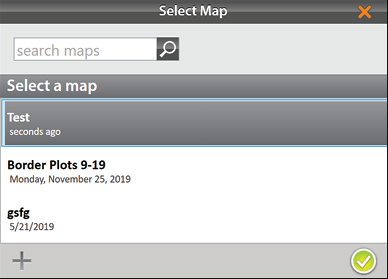
- Tap Maps, select your desired map, and tap Harvest.
- Select a map or tap the plus icon
 to create a new map.
 - Tap the check icon
 .
.
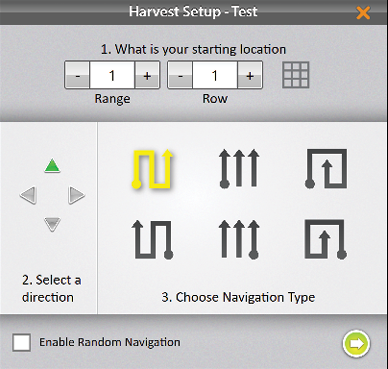
- Enter the starting location.
Note: Click on the matrix to bring up another screen to allow you to choose the starting location.
- Select the direction of harvest.
- Choose a navigation type.
- Tap the next arrow
 .
.
Note: If you check Enable Random Navigation, you will be able to change your location on the main Harvest screen just by tapping on the desired plot. This is mostly used for note taking.
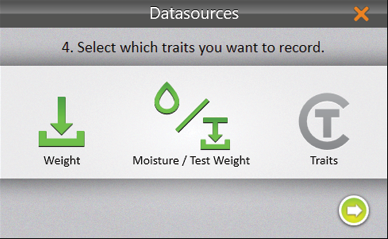
- Select which attributes you plan to record.
Note: Both moisture and test weight must be enabled even if only one trait is desired. The undesired trait can be modified post-process.
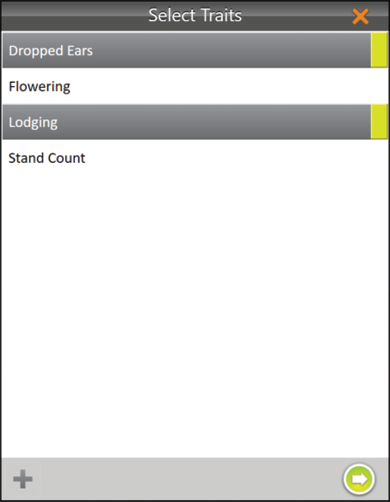
If Traits are enabled, the Select Traits dialog box will appear. You will be prompted to choose a previously configured trait or create a new one. For more information about configuring Traits from the Setup screen, see Create and Record Traits. - Select one or all of the traits to include.
- Tap the next arrow
 .
.
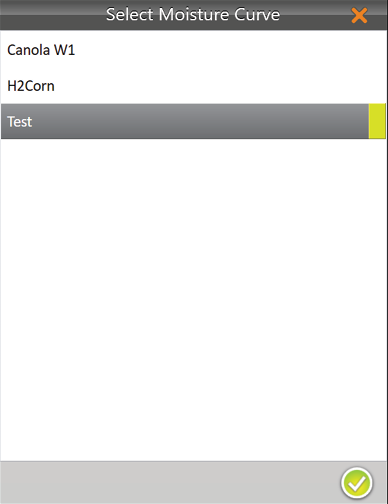
If you selected Moisture/Test Weight, Mirus prompts you to select a moisture curve.
- Select a Moisture Curve.
- Tap the check icon
 .
.
Note: You will only be able to see the SCiO calibration file if you are connected to an H3 GrainGage with a SCiO sensor installed.
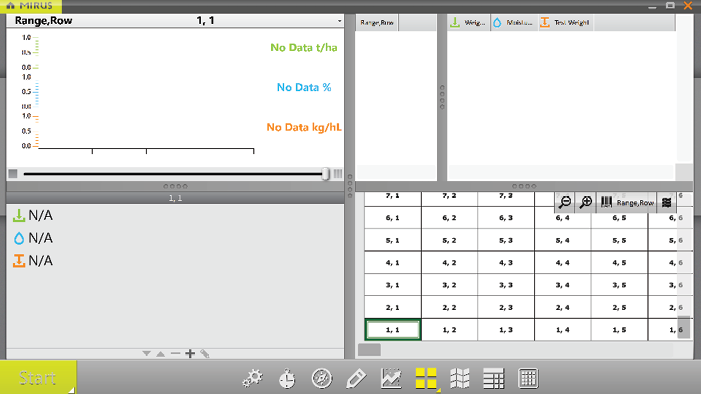
Mirus opens the Harvest screen and is ready to be configured or to collect data. If you have connected an H3 with a SCiO sensor, the SCiO data will display here too.
Configure Harvest Screen Options
The Harvest screen provides several options for configuring how data is collected and presented during harvest.
 Start/Cycle/Countdown/Go Button: Start initiates harvest. Cycle initiates measurements and data collection for a specific plot. Countdown initiates a delay before measurements. Go indicates it’s time to move to the next plot.
![]() Diagnostics: Opens the Diagnostics dialog box for monitoring during harvest.
Diagnostics: Opens the Diagnostics dialog box for monitoring during harvest.
 Cycle Settings: Allows the operator to change the Mode, Button Type, Position, and Countdown time for the Start/Cycle/Countdown/Go button.
 Navigation: Opens the Change Location dialog box and allows the operator to make changes to location, direction, and navigation type.
 Observations: Opens a dialog box in which the operator can record notes for each plot during harvest. This is also where you can add information about any traits you configured.
 Graph View: Displays accumulating data as a graph.
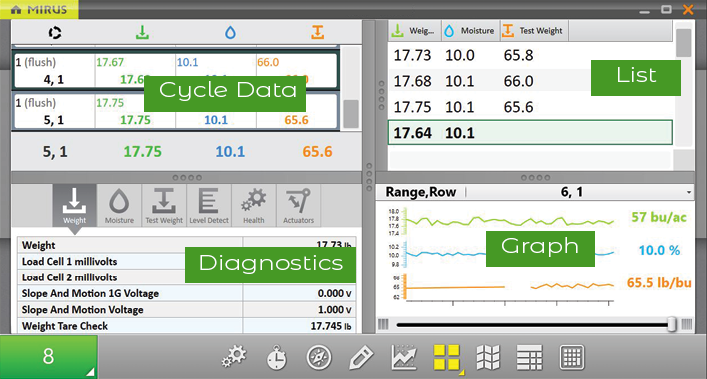
 Quad View: Divides the display into four smaller windows. The operator can adjust the size of each window and customize them each to display data in Cycle Data, Diagnostics, Graph, Info, List, Spatial, or Real Time Weight view. This screen should be used during your harvest.
 Map View: Opens the Spatial Display, also referred to as a heat map. This display can be configured to show attribute data plot by plot.
 List View: Displays accumulating data as a list.
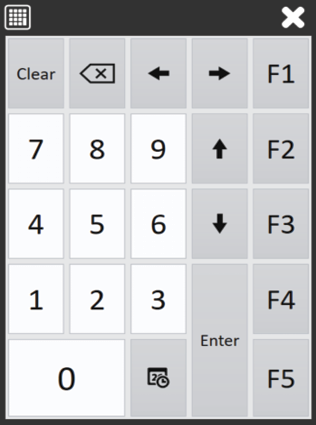
 Ten Key: Numeric keypad for fast entry of trait and note data.
Configure Cycle Settings
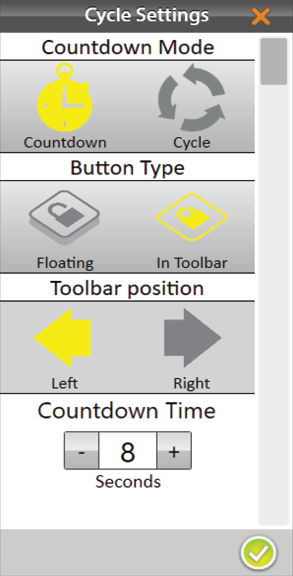
The cycle settings determine the settings of the Start/Cycle/Countdown/Go button. These settings can change the Countdown Mode, Button Type, Toolbar Position, and the Countdown Time.
The countdown timer sets a wait time at the start of each cycle to ensure all the grain in the current plot reaches the GrainGage before cycling.
To configure the Countdown Mode,
- Tap the cycle settings icon
 in the toolbar.
 - Select Countdown or Cycle.
- If you choose Countdown, adjust the countdown time to equal the combine clean-out time. (If you choose Cycle, there is no countdown timer.)
- Tap the check icon .
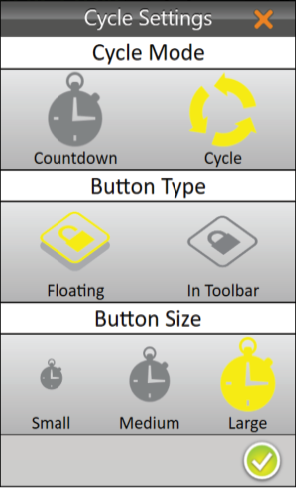
To change the Button Type,
- Tap the cycle settings icon in the toolbar.
- Select Floating or In Toolbar.
When you select Floating, Mirus prompts you to choose the size of the floating Start/Cycle/Countdown/Go button.
If you choose Floating, the Start/Cycle/Countdown/Go button appears as a separate dialog box that can be moved to any location.
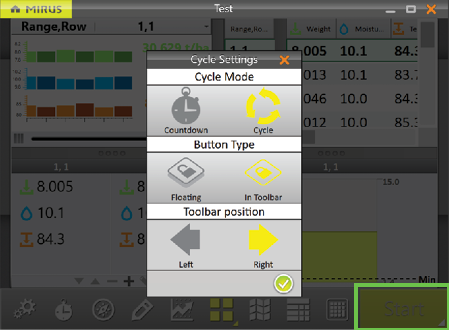
To change the Toolbar position of the button,
- Select In Toolbar.
- Select Left or Right.
The default position is left. If you select right, Mirus moves the Start/Cycle/Countdown/Go button to the other side of the screen. - Tap the check icon .
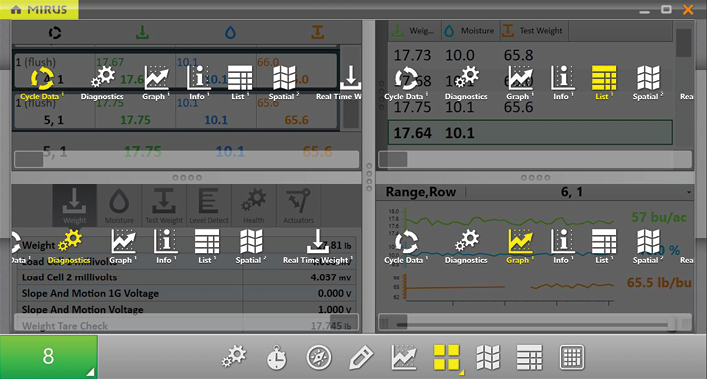
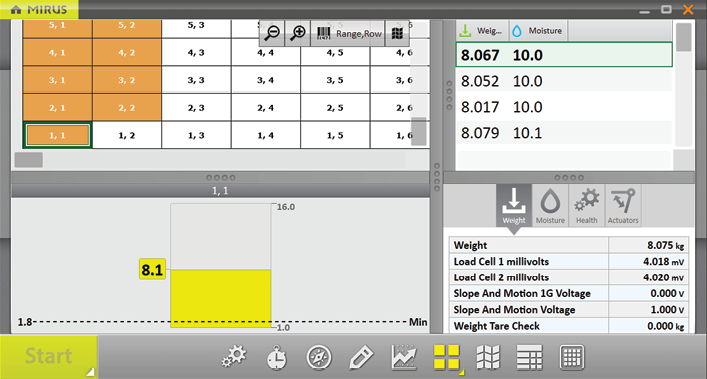
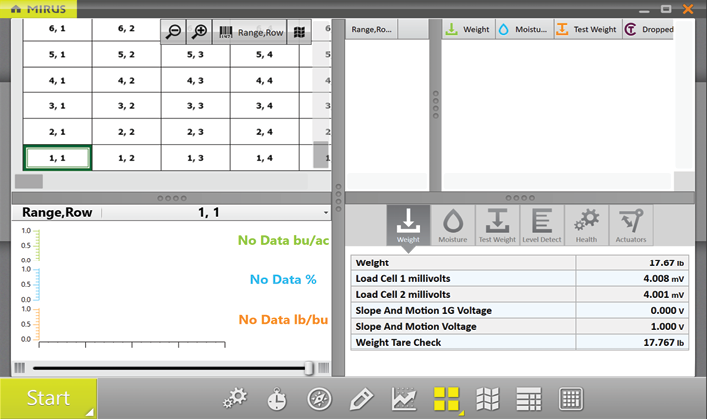
Quad View
Mirus provides the option of viewing four screens at once when Quad View ![]() is selected. Each screen can be configured to display the data differently. The screen options are as follows:
is selected. Each screen can be configured to display the data differently. The screen options are as follows:
- Cycle Data: Displays the plot, weight, moisture, test weight, and trait data for each cycle.
- Diagnostics: Displays the Diagnostics dialog box for monitoring during harvest.
- Graph: Shows the plot progression of weight, moisture, and test weight in a graph.
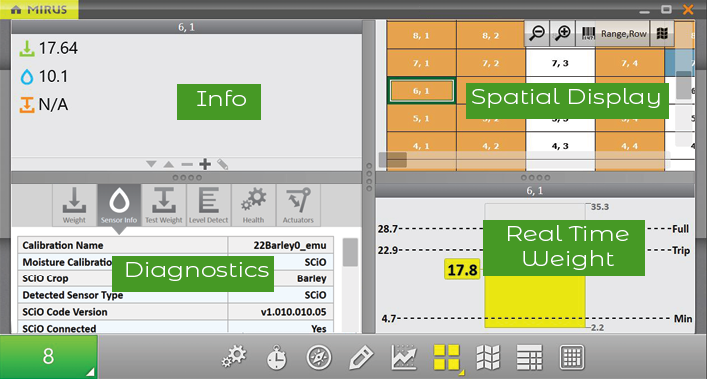
- Info: Displays the weight, moisture, and test weight of the most recent plot.
- List: Displays accumulating data as a list.
- Spatial: Also referred to as a heat map, it shows attribute data with colors plot by plot. The indicating colors are listed below:
- Gold: The plot has harvest data (indent one more level)
- Purple: The plot has trait note data (indent one more level)
- Blue: The plot has a quick note. (indent one more level)
- Real Time Weight: Displays the real time weight of the weigh bucket.
Each of the above options are also available on the main toolbar in Harvest Mode except for the options to view Cycle Data ![]() , Real Time Weight
, Real Time Weight ![]() , and Info
, and Info ![]() .
.
To configure the Quad View screens:
- Enter Quad View by tapping the Quad View icon
 .
.
If desired, enlarge and shrink specific screens by dragging the borders of the Quad View screens. - Tap the Quad View icon a second time. Mirus displays options for each of the four screens.
- Tap the Quad View icon again. Mirus exits the configuration screens.
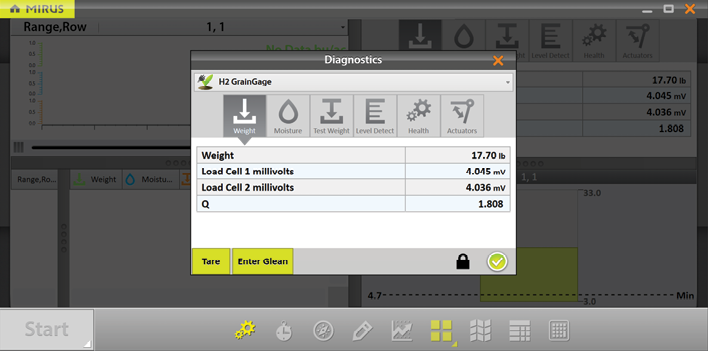
Diagnostics Screen
To access the Diagnostics screen in Harvest Mode,
- Tap the gear icon
 on the toolbar.
 - Select the tab for the diagnostic function you want to see.
Note: If you open the Actuator tab, you can see the status of the gates and actuators while they cycle during the harvest.
Note: The Diagnostics screen will not open while the GrainGage is cycling.
Navigation Screen
To change your location, direction, or navigation type,
- Tap the navigation icon
 to open the Change Location dialog box.
 - Select the location on the map where you wish to resume data collection in one of two ways:
- Tap on the plot in the map.
Or
- Enter the range and row in the fields at the top of the dialog box.
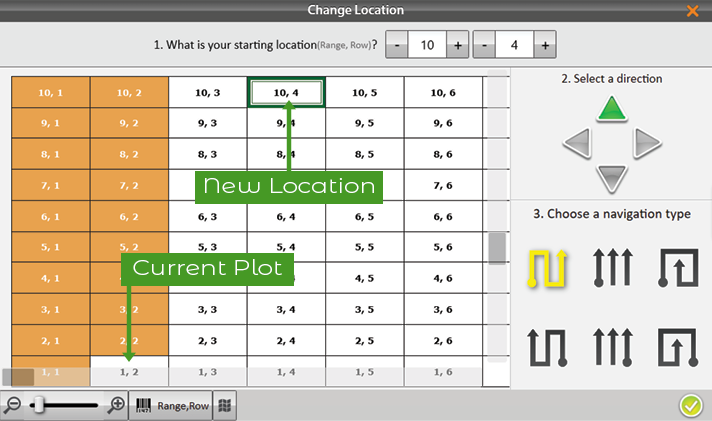
- Select an arrow to change direction.
- Select a navigation pattern by clicking on one of the options in the lower right portion of the window.
- Tap the check icon .
Observations Screen
On the Harvest screen,
- Tap the pencil icon
 to open the Observations window.
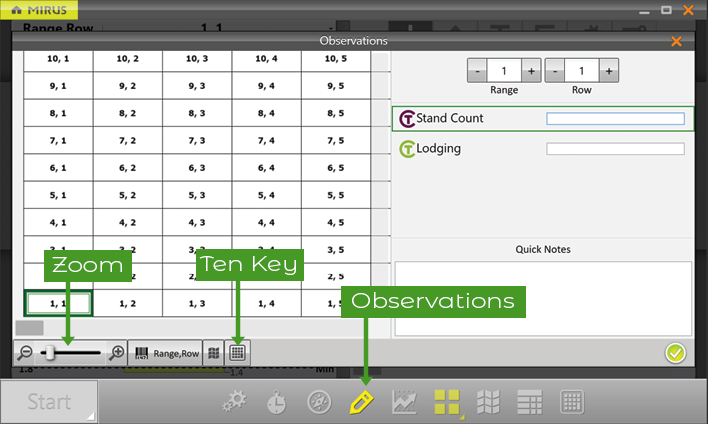
The Observations screen shows plot position and provides character fields for notes on each trait and a Quick Notes text box to record any other observations for each plot. Mirus stores the quick notes and trait notes alongside harvest data.
- Tap the Ten Key icon
 for a floating dialog box that can also enter trait notes and quick notes.
The Ten Key dialog box can also be found on the main toolbar.
Graph View
To view the harvest data in graph form, tap the graph icon ![]() in the toolbar.
in the toolbar.
The column to the right of the graph shows the data for the current plot.
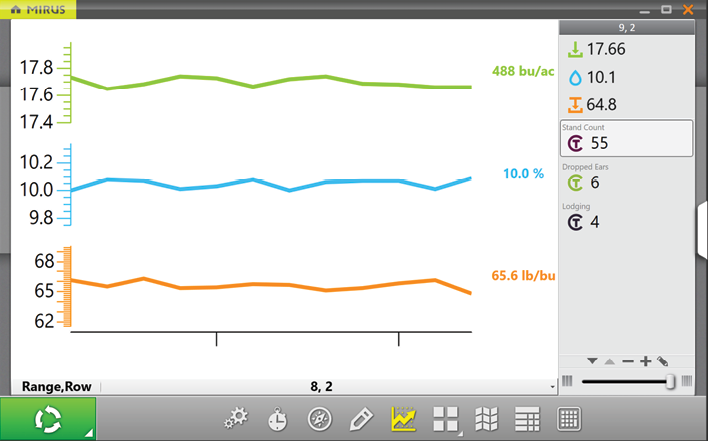
In the graph, each bar (or point in the line graph) represents a plot. Each graph represents the map for three different traits: green for weight, blue for moisture, and orange for test weight. The values shown at the end of the graphs show the averages. The green average shows the yield based on the weight measurements and plot size. To set the yield parameters, see Configure Plot Size and Yield in Spatial Display.
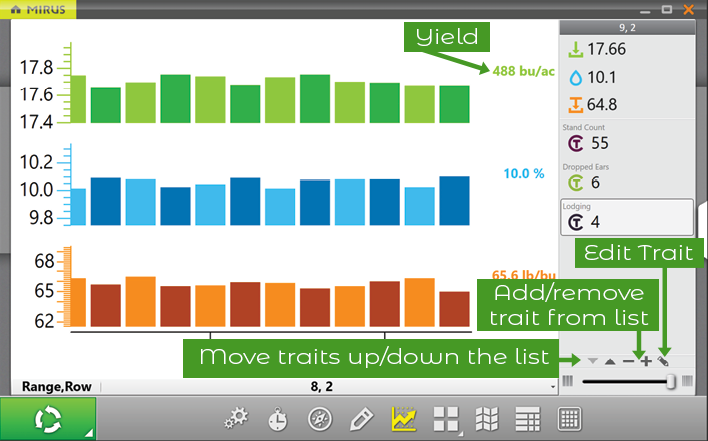
Click on the graph to switch between a bar graph (shown above) and a line graph (shown below).
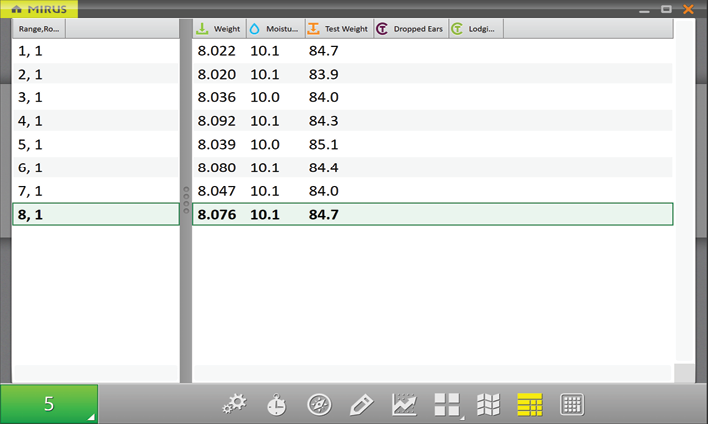
List View
In List View, you can see the data in the form of a spreadsheet.
Configure Weight in Spatial Display
To set the minimum and maximum weight,
- Tap the Spatial Display icon
 to display data in a heat map format.
 - Select the Weight attribute.
- Tap the gear icon in the Attribute bar.
- Set the Minimum and Maximum Weight.
- Tap the check icon .
Adjusting the minimum and maximum values helps to create a more detailed legend and define the scope of the graphs and maps. The narrower the minimum and maximum range, the more detailed the information displayed becomes.
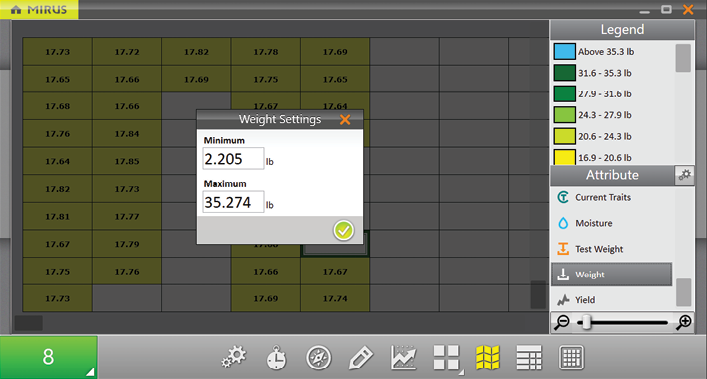
This setting adjusts the maximum weight on the Real Time Weight display, which allows you to track how full the GrainGage is getting with each plot. This is important to monitor so the GrainGage doesn’t overflow. (The minimum weight shown on the Real Time Weight display is adjusted with the Chamber Head Room under Setup > H2 or H3 GrainGage Sensors > Weight.)
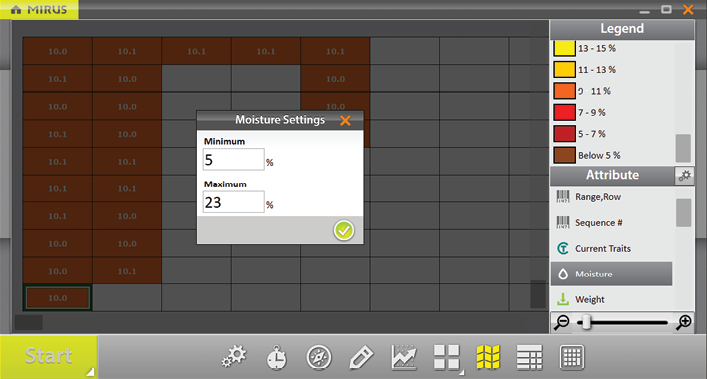
Configure Moisture in Spatial Display
To set the minimum and maximum moisture,
- Tap the Spatial Display icon to display data in a heat map format.
- Select the Moisture attribute.
- Tap the gear icon in the Attribute bar.
- Set the Minimum and Maximum moisture.
- Tap the check icon .
Adjusting the minimum and maximum values helps to create a more detailed legend and define the scope of the graphs and maps. The narrower the minimum and maximum range, the more detailed the information displayed becomes.
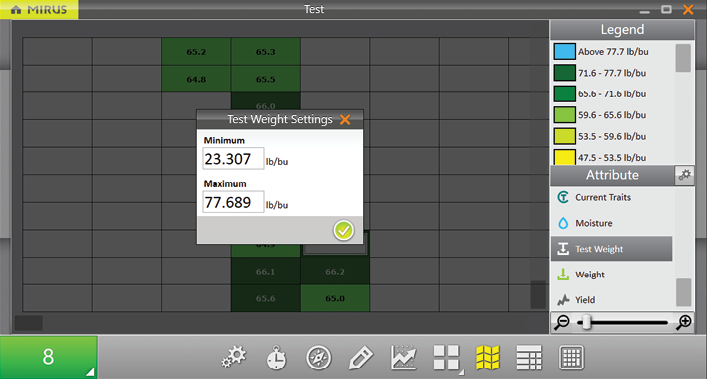
Configure Test Weight in Spatial Display
To set the minimum and maximum test weight,
- Tap the Spatial Display icon to display data in a heat map format.
- Select the Test Weight attribute.
- Tap the gear icon in the Attribute bar.
- Set the Minimum and Maximum Test Weight Settings.
- Tap the check icon .
Adjusting the minimum and maximum values helps to create a more detailed legend and define the scope of the graphs and maps. The narrower the minimum and maximum range, the more detailed the information displayed becomes.
Configure Plot Size and Yield in Spatial Display
To set the minimum and maximum plot size and yield,
- Tap the Spatial Display icon to display data in a heat map format.
- Select the Yield attribute.
- Tap the gear icon in the Attribute bar.
- Set the Plot Length and Width.
- Set the Minimum and Maximum Yield.
- Tap the check icon .
The values set here help calculate the yield per acre (bu/ac, kg/ha) using the weight measurements divided by the plot area. For each minimum and maximum changed, the Legend will change to match the correct values.
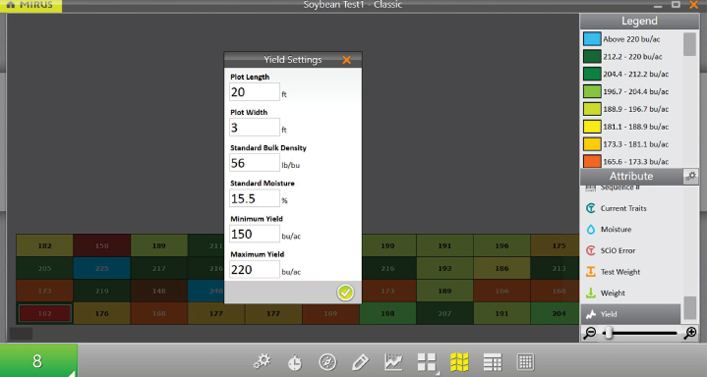
Adjusting the minimum and maximum values helps to create a more detailed legend and define the scope of the graphs and maps. The narrower the minimum and maximum range, the more detailed the information displayed becomes.
For examples of standard bulk density and standard moisture values, see Appendix A: Standard Moisture and Test Weight.
Collect Harvest Data
Harvest with Cycle Button
Note: It is best to use the countdown timer. Using the countdown timer typically gives a more consistent clean-out time from plot to plot which can improve the quality of your data.
- Open the Mirus Harvest screen.
- Select a map, configure the harvest setup, choose traits, and a moisture curve. See Open Harvest Mode for specifics.
- Start the thresher and throttle up.
- Tare the GrainGage if necessary.
- Tap in Mirus.
- Harvest the first plot.
- Press Remote Enter or Cycle
 when all the grain is in the GrainGage.
 - When prompted with a green Go button
 , start into the next plot.
 - Repeat for each plot.
The following table explains each stage of the Start/Cycle/Go button during harvest.
|
Cycle Mode |
|||
| Button Stage | Operator Action | Harvest Stage | |
| 1 | |
Enter press when ready to harvest. | Harvest begins. |
| 2 |  |
Enter press after all the grain has been delivered to the weigh bucket. |
The isolation gate closes. If the trip point is met, the GrainGage will automatically cycle. The GrainGage can cycle several times through the plot until the weight trip no longer occurs. Note: The amount of grain in the weigh bucket can be seen on the Real Time Weight display. Make sure the weight peaks and stabilizes before you press Cycle. |
| 3 |  |
Wait for the cycle to end. | The red cycle indicator appears to show the ongoing cycle. |
| 4 |  |
Proceed to the next plot. | The isolation gate is closed. The GrainGage is running the flush cycle and is ready to harvest the next plot. |
| 5 | |
N/A | The isolation gate is opened. The GrainGage is ready for the next plot. |
| 6 | Return to #2 at the end of the next plot. | Mirus is ready to begin the cycle for the next plot. | |
Harvest with Countdown Timer
Note: It is best to use the countdown timer. Using the countdown timer typically gives a more consistent clean-out time from plot to plot which can improve the quality of your data.
To harvest with the countdown timer,
- Open the Mirus Harvest screen.
- Select a map, configure the harvest setup, choose traits, and choose a moisture curve. See Open Harvest Mode for specifics.
- Start the thresher and throttle up.
- Tare the GrainGage if necessary.
- Tap the in Mirus.
- Harvest the first plot.
- When the head is stopped in the alley and clear, start the countdown timer by pressing remote enter or tapping the countdown timer button
 .
.
Note: It is critical the countdown timer is set long enough for all the grain to be delivered to the GrainGage before reaching zero. - When prompted with a green Go button , start into the next plot.
- Repeat for each plot.
The following table explains each stage of the Start/Countdown/Go button during harvest.
| Countdown Mode | |||
| Button Stage | Operator Action | Harvest Stage | |
| 1 | |
Enter press. | Harvest begins. |
| 2 |  |
Enter press at the end of the plot after all the grain has cleared the head. |
The GrainGage is waiting for the trip point to be met or an Enter press at the end of the plot. If the trip point is met, the GrainGage will automatically cycle. The GrainGage can cycle several times through the plot until the weight trip occurs. Note: The amount of grain in the weight bucket can be seen on the Real Time Weight screen. An Enter press begins the countdown. |
| 3 |  |
Wait until the countdown ends. |
The countdown indicates the amount of time set to complete the grain delivery to the GrainGage before the cycle starts. Note: If the weight trip is triggered during the countdown, the timer will continue as the GrainGage cycles. If the timer has reached zero before the weigh cycle finishes, the flush cycle will begin after the weigh cycle is complete. |
| 4 |  |
N/A | The yellow indicator briefly appears to show the isolation gate is closing and the GrainGage is starting to cycle. |
| 5 | |
Proceed to the next plot. | The isolation gate is closed. The GrainGage is running the flush cycle and it is ready to harvest the next plot. |
| 6 | |
N/A | The isolation gate is opened. The GrainGage is ready for the next plot. |
| 7 | Return to #2 at the end of the next plot. | Mirus is ready to begin the cycle for the next plot. | |