Appendix D: Take Notes in Mirus
Mirus Note Taking provides a simplified process of taking notes in the field using many of the same tools supplied for harvest. Mirus Note Taking uses intuitive data collection forms, color-coded heat maps, and customized pick lists to help streamline your data collection process. It can help identify sections within your plots by range and row, or by a specific sub-section of your trial using sub-maps (as explained in 6. Field Maps). The navigation feature tracks your location as you walk and collect data within the field. By adding the GNSS plugin you can have the option to locate and navigate to plot information using GNSS coordinates.
Enter Note Taking
- Disable the GrainGage (if connected) by clicking on the plugin with the green check.
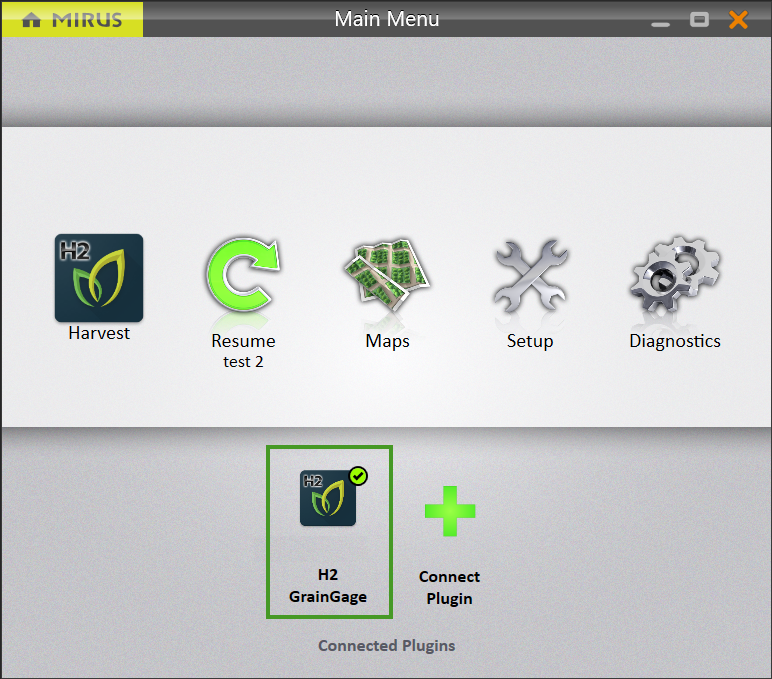
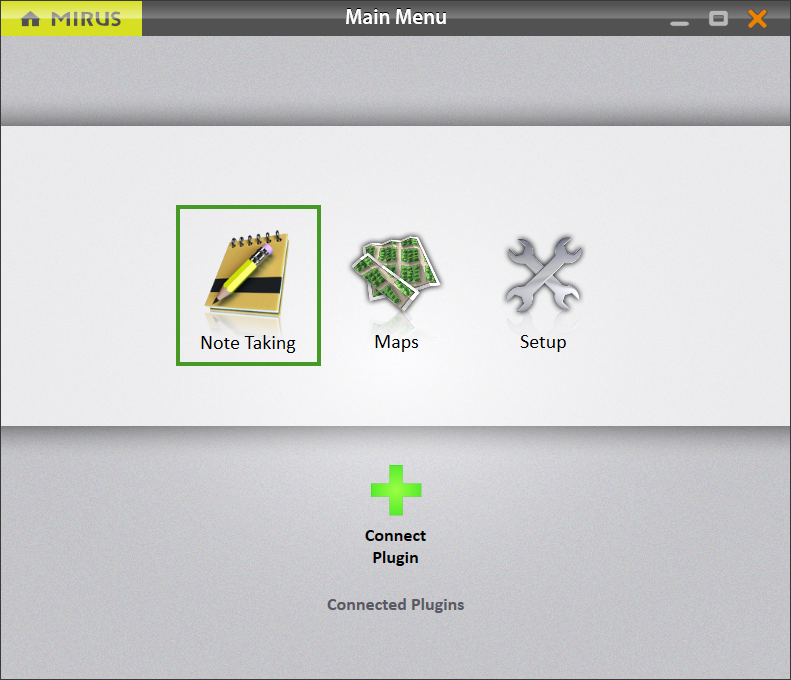
- Tap Note Taking.
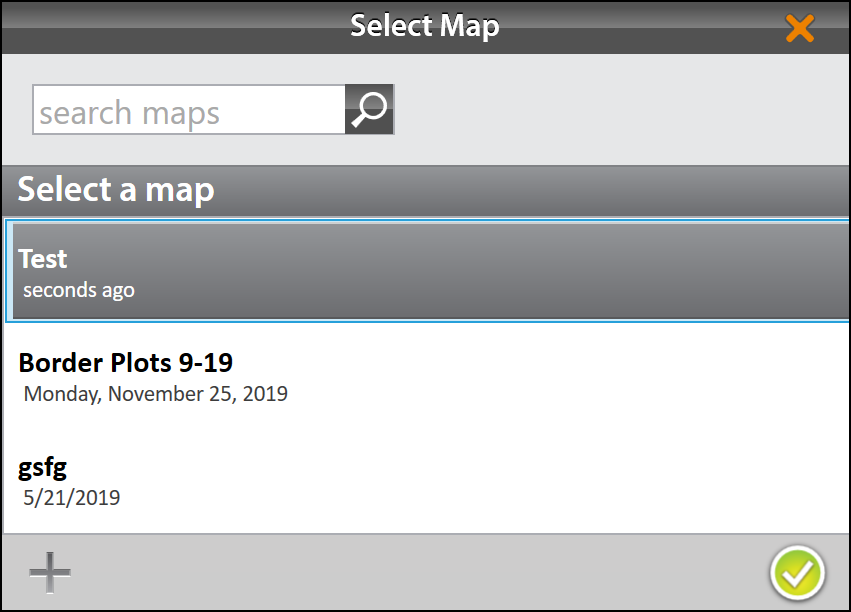
- Select a map or tap the plus icon
 to create or import a new map.
 - Tap the check icon
 .
.
For more information about creating or importing a map, see Create a Range Row Field Map, Create a Standard Plot ID Map or Import a Map.
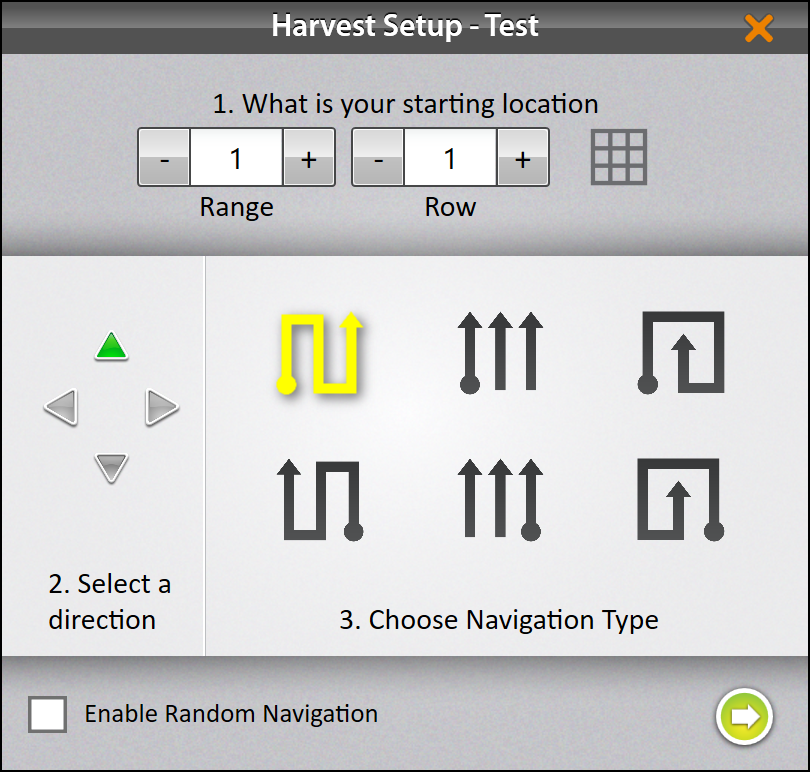
- Enter the starting location.
Note: Click on the matrix ![]() to bring up another screen to allow you to choose the starting location.
to bring up another screen to allow you to choose the starting location.
- Select the direction of harvest.
- Choose a navigation type.
- Tap the next arrow
 .
.
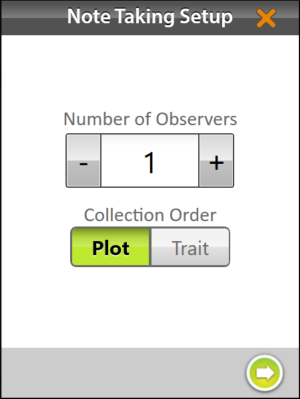
- Enter the number of observers and the collection order.
- Number of Observers: Multiple observers can use the same handheld device. The person holding the handheld will add the notes from the additional observers.
- Plot Order: Mirus will prompt you to enter all the selected traits for each plot before moving to the next observer.
- Trait Order: Mirus will prompt you to enter one trait at a time per plot through all the observers before routing to the next row or range.
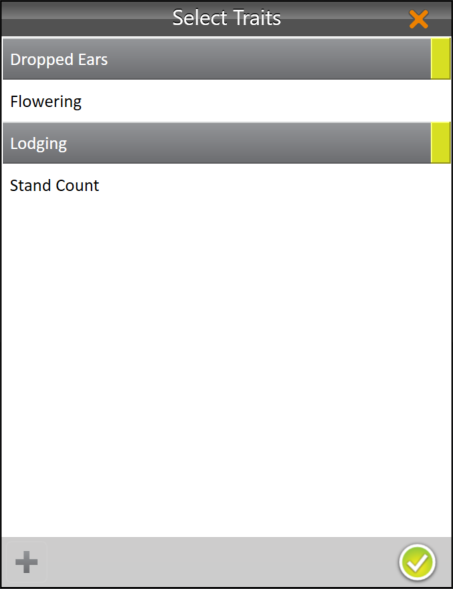
- Select one or all of the traits to include.
- Tap the green check .
For more information about configuring Traits from the Setup screen, see Create and Record Traits.
Mirus opens the Note Taking screen and is ready to be configured or collect data.
Configure the Note Taking Screen
The Note Taking Quad View is similar to the Harvest Mode Quad View (Configure Harvest Screen Options). It can provide several options for configuring how data is collected and presented during collection.
![]() Navigation: Opens the Change Location dialog box and allows the operator to make changes to location, direction, and navigation type.
Navigation: Opens the Change Location dialog box and allows the operator to make changes to location, direction, and navigation type.
![]() Observations/Notes: Opens a dialog box where the operator can record notes for each plot during harvest. This is also where you can add information about any traits you configured.
Observations/Notes: Opens a dialog box where the operator can record notes for each plot during harvest. This is also where you can add information about any traits you configured.
![]() Quad View: Divides the display into four smaller windows. The operator can adjust the size of each window and customize them each to display data in List, Spatial, Observations/Notes, or Ten Key view. This screen should be used during collection.
Quad View: Divides the display into four smaller windows. The operator can adjust the size of each window and customize them each to display data in List, Spatial, Observations/Notes, or Ten Key view. This screen should be used during collection.
![]() Map View: Opens the Spatial Display, also referred to as a heat map. This display can be configured to show attribute data plot by plot.
Map View: Opens the Spatial Display, also referred to as a heat map. This display can be configured to show attribute data plot by plot.
![]() List View: Displays the accumulating data as a list.
List View: Displays the accumulating data as a list.
![]() Ten Key: Numeric keypad for fast entry of trait and note data.
Ten Key: Numeric keypad for fast entry of trait and note data.
Navigation Screen
The Navigation screen can be used to change your location, direction, or navigation type. For more information about this screen, see Navigation Screen.
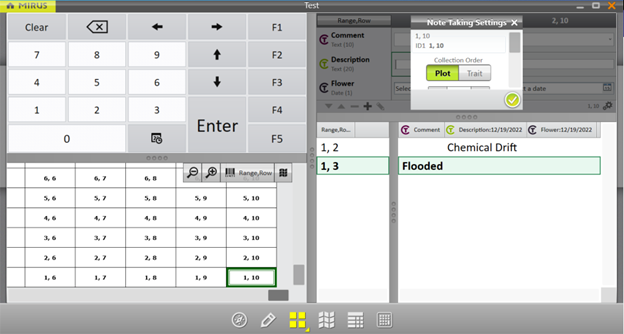
Observations/Notes Screen
The Observation/Notes screen shows plot position and provides character fields for notes on each trait.
When this screen is selected as on of the Quad Views, data entry uses the navigation function defined by the user to move from plot to plot. This screen works well for ratings or counts collected on every plot.
When this screen is selected from the toolbar, it allows data entry on a random plot selection, such as heading or maturity data collection. Just select the plot from the spatial view then enter data using the keyboard. A quick note can also be entered from this screen.
In addition, on this screen you can manually open the Note Taking Settings by tapping the gear icon ![]() in the lower right corner.
in the lower right corner.
For more information about this screen, see Observations Screen.
Quad View
Mirus provides the option of viewing four screens at once when Quad View is selected. Each screen can be configured to display the data differently. The screen options are as follows:
- List—Displays accumulated data as a list.
- Spatial—Also referred to as a heat map, it shows attribute data with colors plot by plot. This is the only screen that can be shown in multiple quadrants.
- Notes—Opens a dialog box where the operator can record notes for each plot during harvest.
- Ten Key—Numeric keypad for fast entry of trait and note data.
The quad data collection screen is optimized to for the portrait screen orientation of the Mesa 2 or Mesa 3.
For more information about this screen, see Quad View.
Map View
The Map View shows the Spatial Display, also referred to as a heat map. This display can be configured to show attribute data plot by plot. You can use the Attribute list to select the data you want displayed.
For more information about configuring this screen, see Configure Weight in Spatial Display, Configure Moisture in Spatial Display, Configure Test Weight in Spatial Display, or Configure Plot Size and Yield in Spatial Display.
List View
In List View, you can see the data in the form of a spreadsheet.
Ten Key
The Ten Key provides a way to enter quick notes. It can be accessed from the Quad View or the toolbar.
For more information about this screen, see Observations Screen.
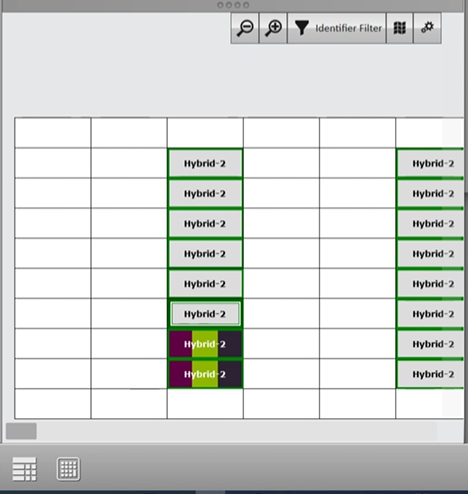
Identifier Search (Imported Maps Only)
With imported maps, you can search identifiers to find certain plots in the field that are part of a test block you want to collect data on. This feature can only be used on maps that are imported with identifiers.
- Select the Identifier Filter from the attribute list.
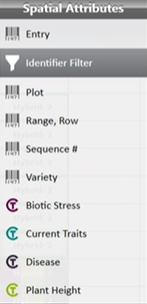
- Select the settings gears.
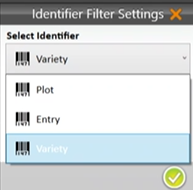
- Select the identifier you would like to filter/search.
Note: The options available from the drop-down menu will vary based on your map.
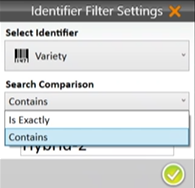
- Choose “is exactly” or “contains.”
- Enter your search criteria.
Note: The search criteria must be based on information included in your map. - Tap the .
With the identifier filter applied, the spatial view will show only the plots that contain that match.