Appendix E: Take Notes in Mirus
Mirus Note Taking provides a simplified process of taking notes in the field using many of the same tools supplied for harvest. Mirus Note Taking uses intuitive data collection forms, color-coded heat maps, and customized pick lists to help streamline your data collection process. It can help identify sections within your plots by range and row, or by a specific sub-section of your trial using sub-maps (see Create a Sub-Map). The navigation feature tracks your location as you walk and collect data within the field. By adding the GNSS plugin you can have the option to locate and navigate to plot information using GNSS coordinates.
Enter Note Taking
- Disable the GrainGage (if connected) by tapping it.
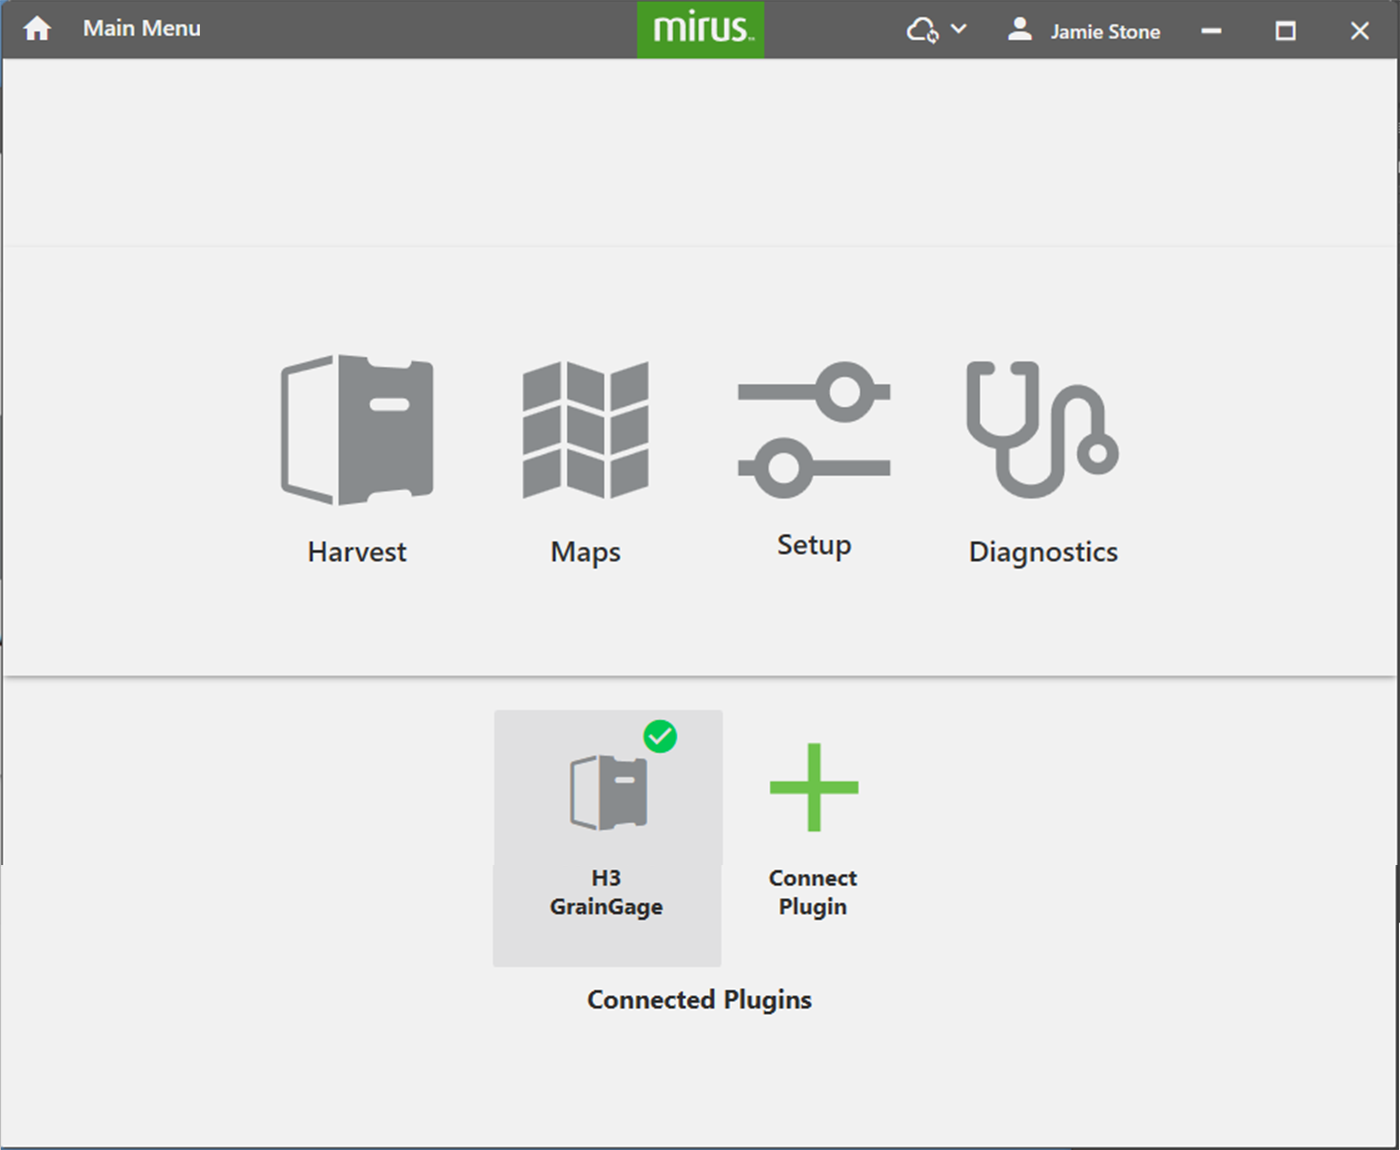
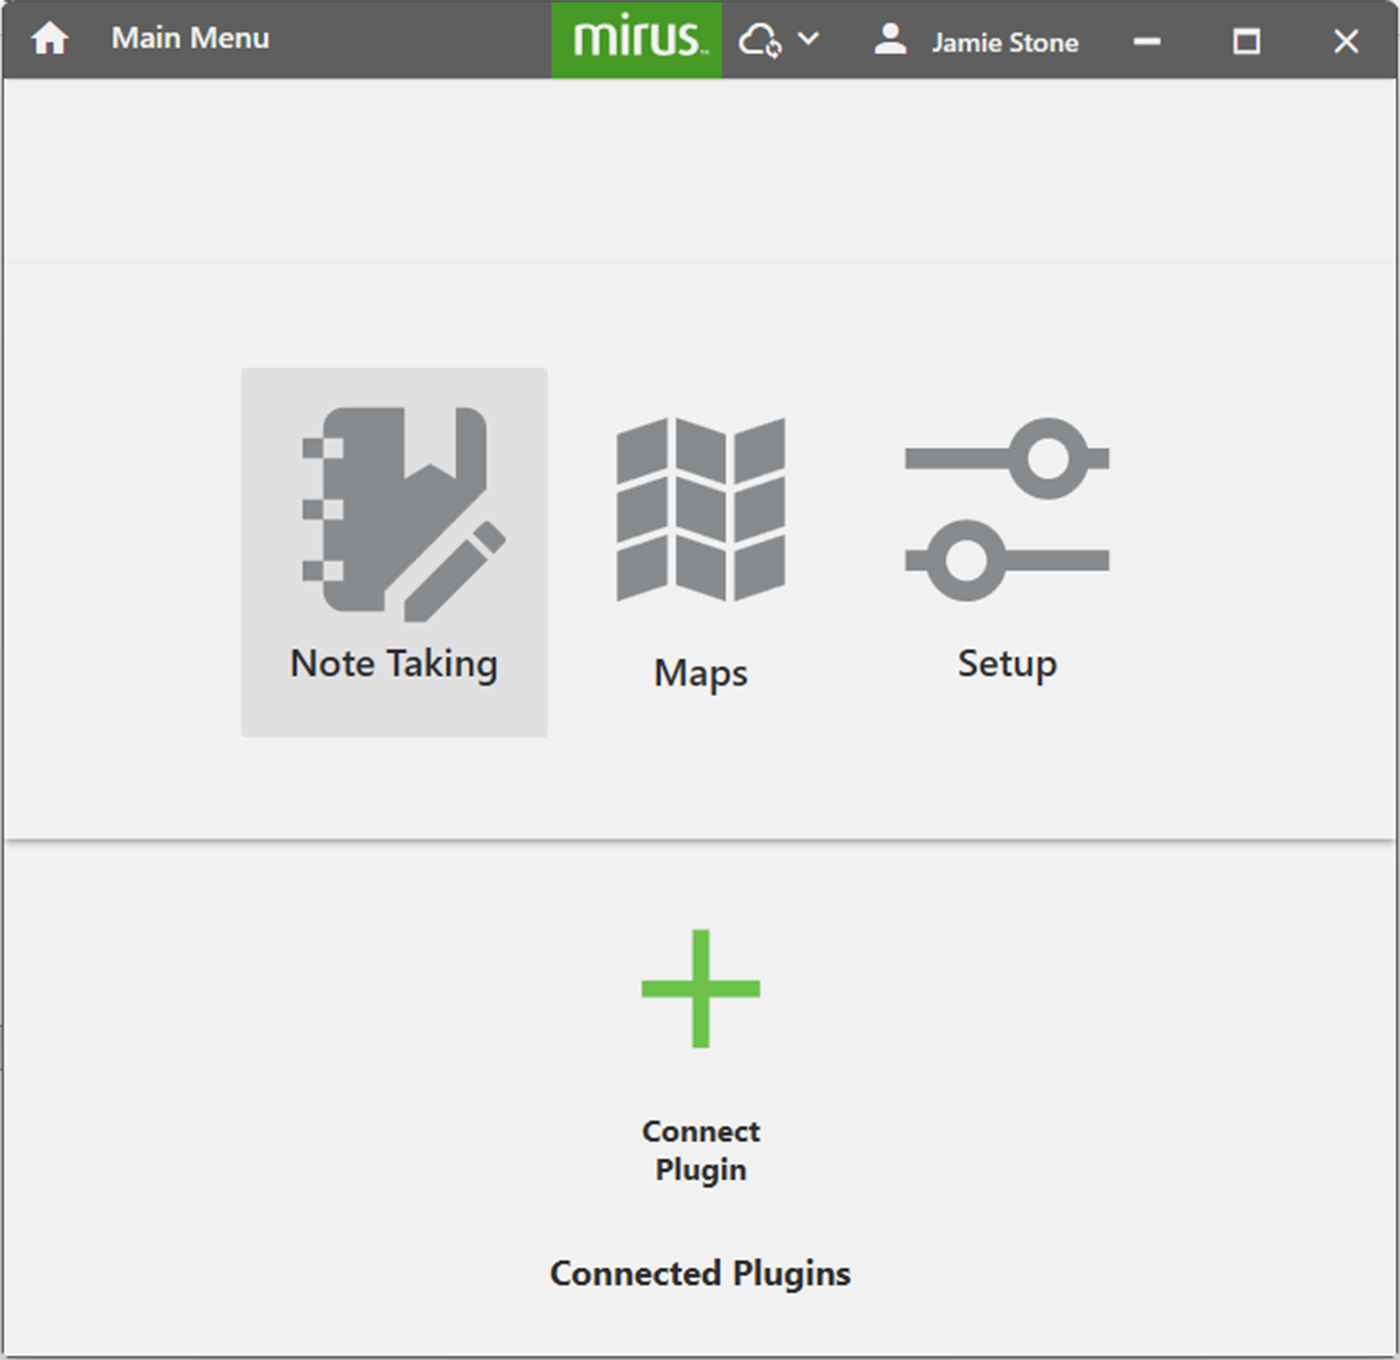
- Tap Note Taking.
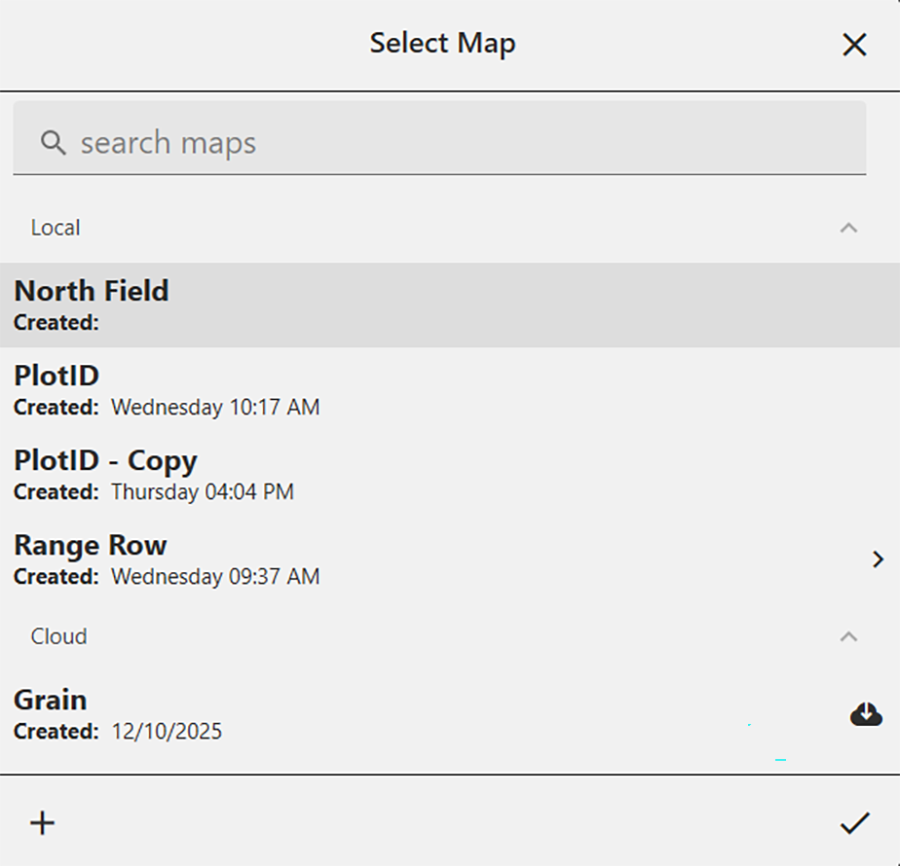
- Select a map or tap
 to create or import a new map.
For more information about creating or importing a map, see Create a Range Row Field Map, Create a Standard Plot ID Map or Import a Map.
- Tap
 .
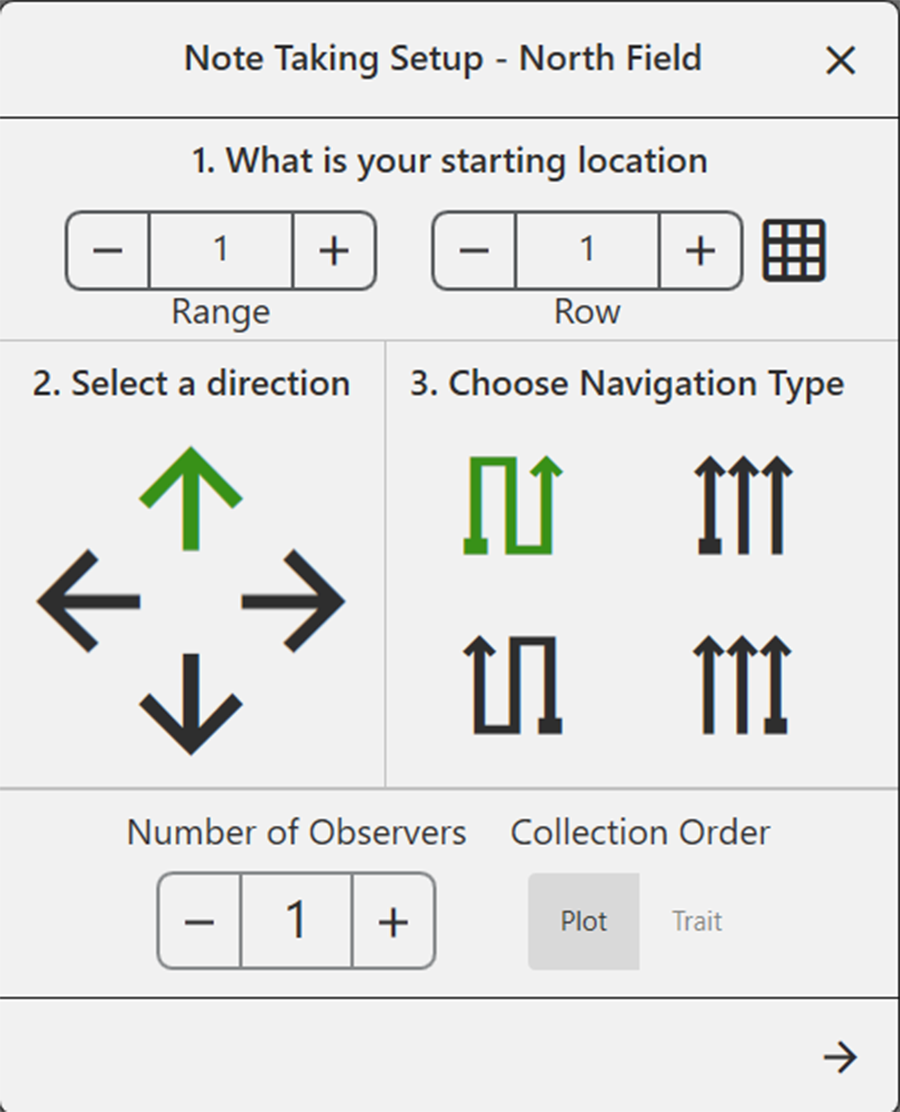
. - Enter the starting location.
Use the matrix to choose the starting location.
- Select the direction of harvest.
- Choose a navigation type.
- Enter the number of observers.
Multiple observers can use the same handheld device. The person holding the handheld will add the notes from the additional observers. - Enter the collection order.
- Plot. Mirus will prompt you to enter all the selected traits for each plot before moving to the next observer.
- Trait. Mirus will prompt you to enter one trait at a time per plot through all the observers before routing to the next row or range.
- Tap
 .
.
- Tap .

- Select one or all of the traits to include.
Choose a previously configured trait or create a new one. For more information about configuring Traits from the Setup screen, see Create Traits.
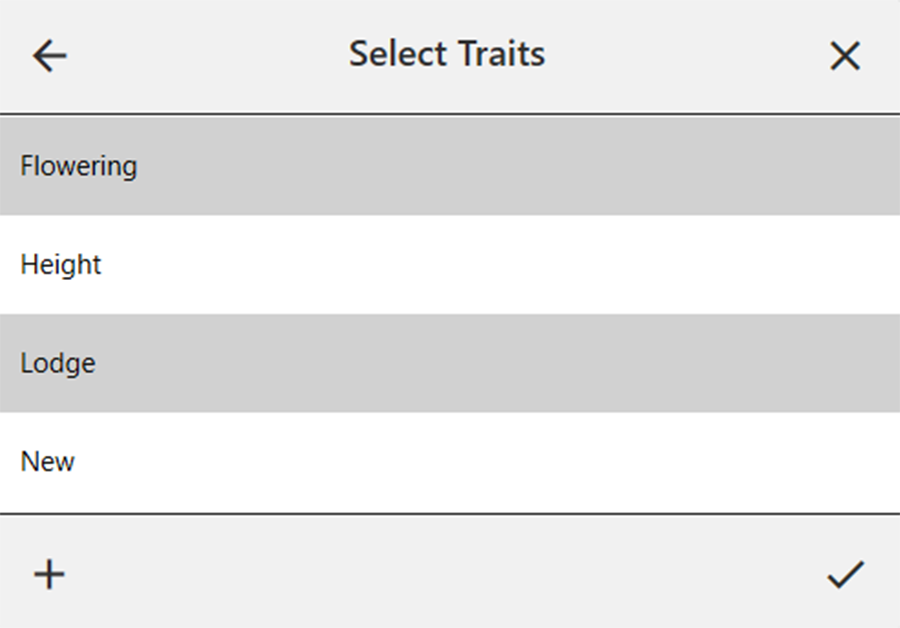
- Tap .
Mirus opens the Note Taking screen in quad view ready to collect data or be configured.

Configure the Note Taking Screen
The Note Taking screen provides several options for configuring how data is collected and presented during note taking. The default view of the Note Taking screen shows four evenly-spaced panes that display the spatial view (twice), the list view, and notes entry. (Descriptions and additional options are described below.)
|
Note Taking Screen Options |
||
|---|---|---|
| Icon | Option | Description |
| Navigation | Opens the Change Location dialog box and allows the operator to make changes to location, direction, and navigation type. | |
| Observations | Opens a dialog box where the operator can record notes for each plot during harvest. This is also where you can add information about any traits you configured. | |
|
Quad View |
The default view. Divides the display into four panes. The operator can adjust the size of each window and customize them each to display in List, Spatial, Observations/Notes, or Ten Key view. This screen should be used during collection. |
|
| Spatial View | Opens the Spatial Display, also referred to as a heat map. This display can be configured to show attribute data plot by plot. | |
| List View | Displays accumulating data as a list. | |
| Ten Key | Numeric keypad for fast entry of trait and note data. | |
Change Starting Location
The Navigation screen can be used to change your location, direction, or navigation type.
To change your location, direction, or navigation type,
- Tap
 to open the Change Location dialog box.
 - Select the location on the map where you wish to resume data collection in one of two ways:
- Tap the plot in the map.
- Enter the range and row in the fields at the top of the dialog box.

- Select an arrow to change direction.
- Select a navigation pattern by tapping one of the options.
- Tap .
|
Change Location |
||
|---|---|---|
| Icon | Option | Description |
| Zoom out | Enlarge the size of the plots shown. | |
| Zoom in | Decrease the size of the plots shown. | |
| Attributes | See different attribute data on the map. | |
| Legend | Defines what the colors on the map mean. | |
Observations
The Observations box shows the spatial view of your plot position, provides entry fields for each trait, and accepts a quick note related to the plot.
You can use the Observations box for data entry on a plot selected outside the navigation type, such as heading or maturity data collection. Just select the plot from the spatial view, then enter data using the keyboard.
Tap ![]() to save your entries.
to save your entries.

|
Change Location |
||
|---|---|---|
| Icon | Option | Description |
| Zoom out | Enlarge the size of the plots shown. | |
| Zoom in | Decrease the size of the plots shown. | |
| Attributes | See different attribute data on the map. | |
| Legend | Defines what the colors on the map mean. | |
| Ten Key | Open the ten key box. | |
Quad View
Mirus provides the option of viewing four panes at once when Quad View is selected. Each screen can be configured to display the data differently. The options are described in the following table.
|
Quad View |
|
|---|---|
| Option | Description |
|
Displays accumulating data as a list. |
|
|
Displays attribute data with colors plot by plot. It is also referred to as a heat map. The colors are listed below:
This is the only screen that can be shown in multiple quadrants. See the Quad View Spatial Options table below for explanation of how you can change what is displayed. For more information about configuring this screen, see Configure Weight in Spatial View, Configure Moisture in Spatial View, Configure Test Weight in Spatial View, or Configure Plot Size and Yield in Spatial View. |
|
|
Displays the traits entry fields. See the Quad View Notes Options table below for explanation of how you can change what is displayed. |
|
| Displays ten key-style buttons for easier data entry. | |
|
Quad View Spatial Options |
||
|---|---|---|
| Icon | Option | Description |
| Zoom out | Enlarge the size of the plots shown. | |
| Zoom in | Decrease the size of the plots shown. | |
| Spatial Attributes | See different attribute data, including traits, on the map. | |
| Legend | Defines what the colors on the map mean. | |
|
Quad View Notes Options |
||
|---|---|---|
| Icon | Option | Description |
| Move Trait Down | Move the currently selected trait down in the list. | |
| Move Trait Up | Move the currently selected trait up in the list. | |
| Remove Trait | Remove the currently selected trait. | |
| Add Trait | Add a new or existing trait. For new traits, see Create Traits. | |
| Edit Trait | Change the default value of the trait, if it includes one. | |
| Plot Identifiers | For imported maps that include more than one plot ID, select up to three IDs to display. Additional identifiers are displayed along the bottom of the graph. | |
To configure the Quad view:
- Tap
 from the quad view of the Harvest screen.
You can enlarge or shrink specific sections by dragging the borders.

- Tap the desired content icon in each section of the screen. The currently displayed content is highlighted.
- Tap again to close the content selection icons.
The following picture show examples of what each of the options looks like in the Quad View.

The quad data collection screen is optimized for the portrait screen orientation.
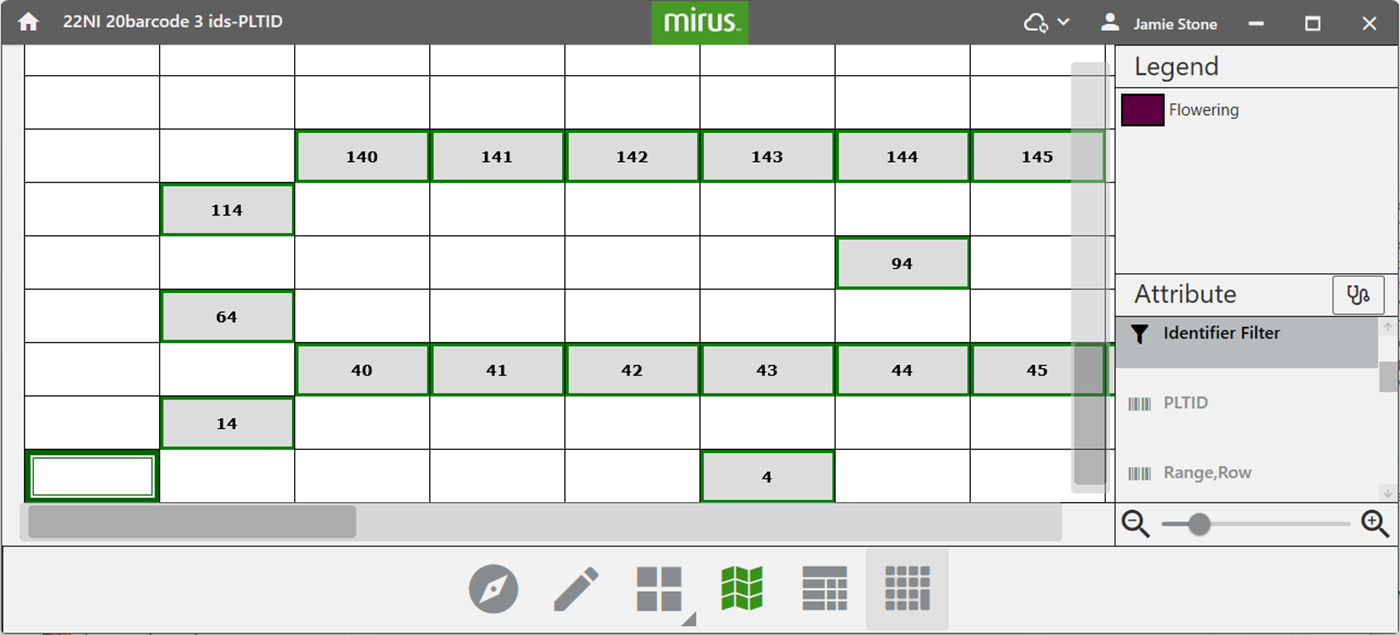
Identifier Search (Imported Maps Only)
With imported maps, you can search identifiers to find certain plots in the field that are part of a test block you want to collect data on. This feature can only be used on maps that are imported with identifiers.
From the spatial view, either as displayed in the quad view or as the full screen,
- Select Identifier Filter from the attribute list.
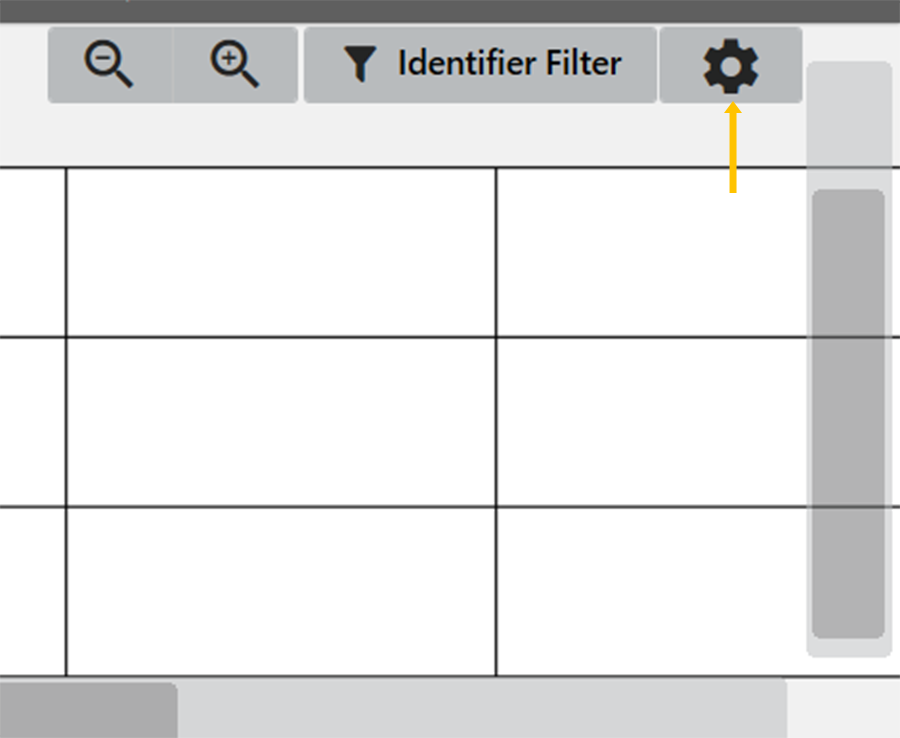
- Tap
 or
or  .
.
Spatial View 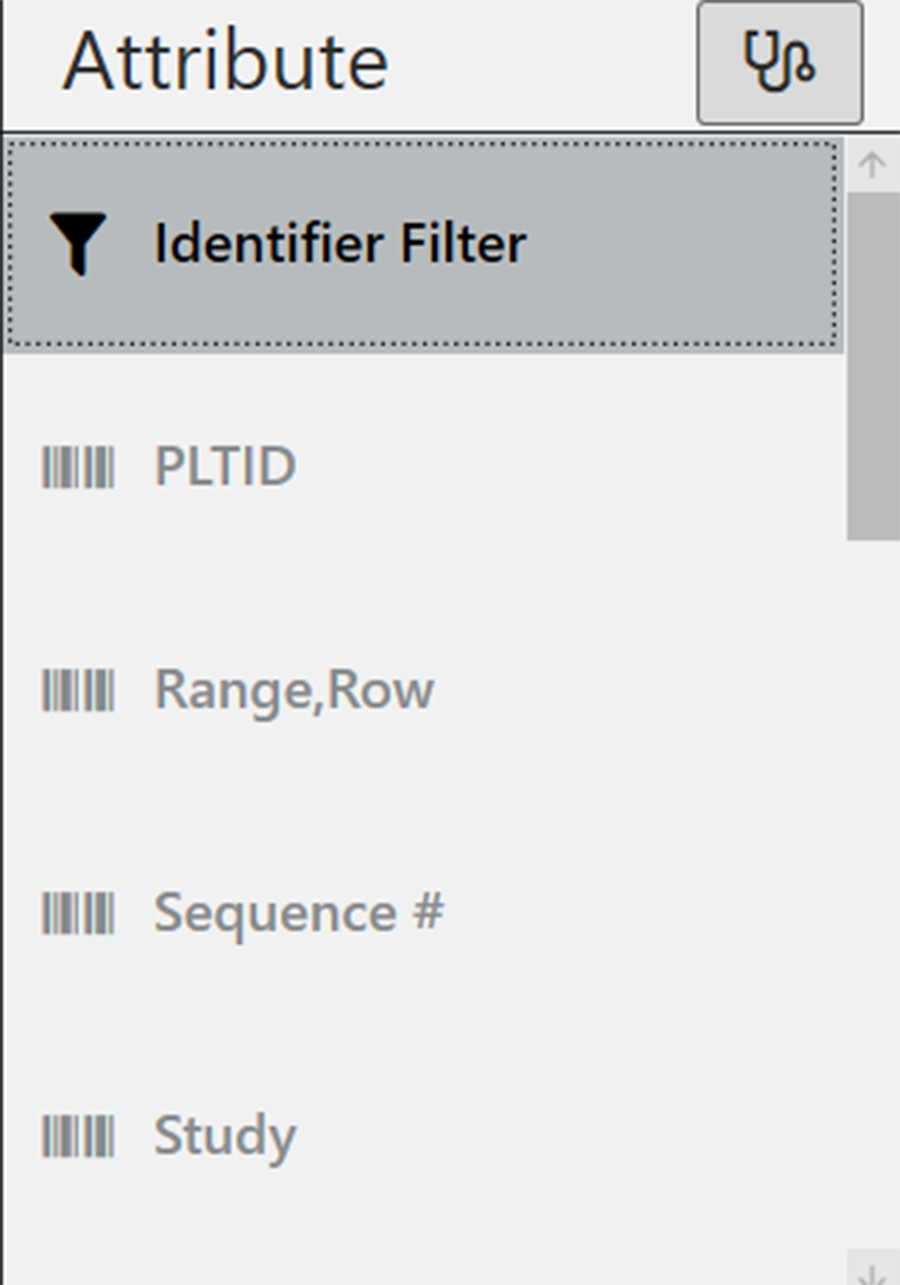
Quad View 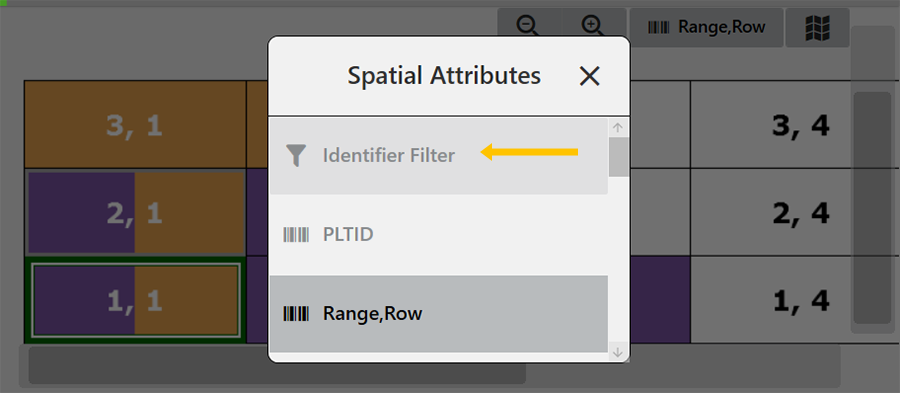
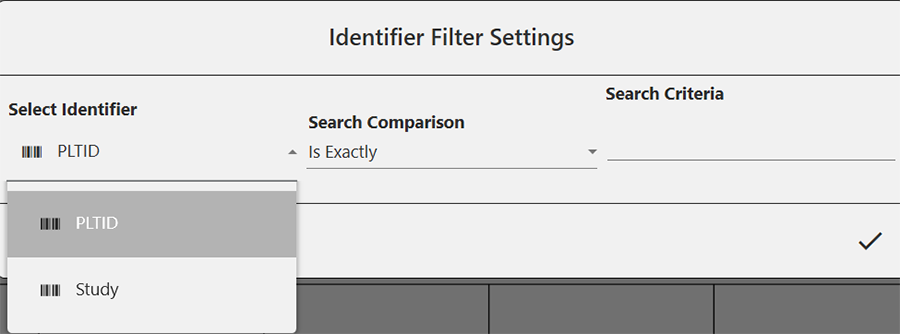
- Select the identifier you would like to filter/search.
The options available from the drop-down menu will vary based on your map.
- Choose is exactly or contains.
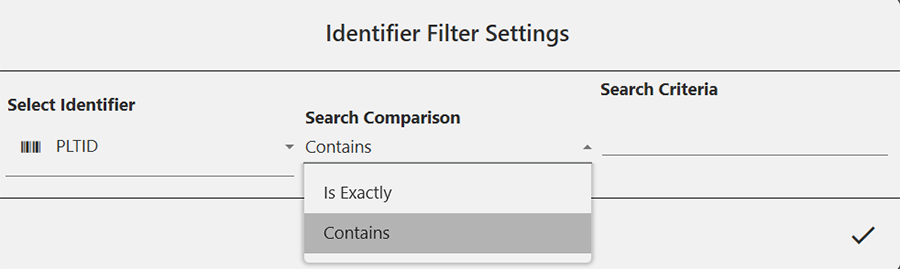
- Enter your search criteria.
The search criteria must be based on information included in your map.
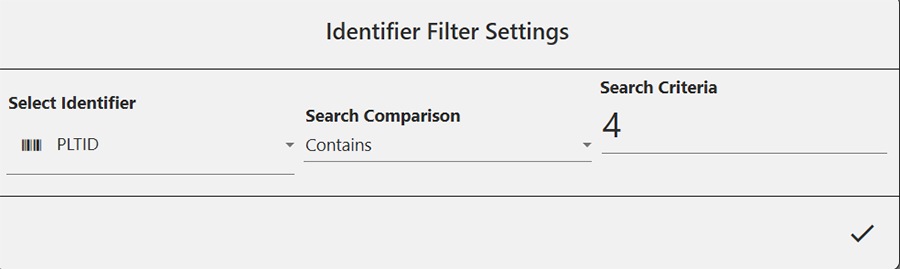
- Tap .
With the identifier filter applied, the spatial view will show only the plots that contain that match.