Chamber Calibration
Creating a calibration file (moisture curve) is an essential part of the harvesting process. The calibration file you use must be created specifically for your harvest conditions. Because the accuracy of your data depends on this calibration file, be extremely careful and precise as you create it. Mirus makes the calibration file creation process easy, but please note the following details about your sensor.
SCiO Sensor Considerations
The chamber calibration will create a SCiO Calibration File (moisture curve) that stores the type of crop being harvested, the calibrated chamber volume, the number of inserts, the offsets to the default SCiO data predictions, and other pertinent data. While Mirus allows you to offset SCiO data using the Recalibrate feature within the calibration file, HarvestMaster advises against offsetting. We recommend creating a calibration file specifically for your harvest conditions as described in Create a SCiO Calibration File.
EM2/3 Sensor Considerations
M2.0 Moisture
The chamber calibration will create an M2.0 Calibration File (moisture curve) that stores the type of crop being harvested, the calibrated chamber volume, the number of inserts, the offsets to the default M2.0 moisture prediction, and other pertinent data. When creating an M2.0 Calibration File, Mirus will automatically generate an EM Moisture Curve within the same file. Although you will only see the M2.0 predictions during harvest, both moisture methods (M2.0 & EM) are calculated and available for export.
EM Moisture
The chamber calibration will create an EM Calibration File (moisture curve) that stores the calibrated chamber volume, the number of inserts, a relationship between the output of the EM Sensor and a moisture prediction (a curve), and other pertinent data. If the desired crop is available via M2.0, HarvestMaster recommends creating an M2.0 Calibration File and not an EM Calibration File.
Chamber Calibration Best Practices
Calibrate the slope and motion, bucket weight, and test weight load cell before the chamber calibration adjusts the test weight chamber volume.
Maintain the air pressure at 75 lb (34 kg) during the chamber calibration. If necessary, run the combine to maintain the air pressure.
Before harvesting, generate a chamber calibration (moisture curve).
Chamber calibrations:
- Align the test weight with a benchtop lab sensor.
- Align constituents (including moisture) if desired.
- Correlate the number of inserts and crops used.
- Set a temperature baseline.
If you add or remove low-volume inserts, you must recalibrate or create a new calibration file (moisture curve) specific to your current setup.
With the release of Mirus 4.5.0 there are three ways to perform a chamber calibration:
- SCiO calibration
- The SCiO data is only available when Mirus has connected to the H3 GrainGage and you are using a SCiO NIR sensor.
- For more information about the SCiO calibration, see Create a SCiO Calibration File.
- M2.0 moisture calibration
- The M2.0 moisture model is a preset model that is used with EM2 and EM3 sensors.
- For more information about the M2.0 moisture calibration, see Create an M2.0 Calibration File.
- EM moisture curve
- For more information about the EM moisture curve, see Create an EM Calibration File.
| Grains Scanned by each Sensor | |
| Sensor | Grain |
| SCiO |
Wheat—Moisture, Protein Corn—Moisture Soybean—Moisture, Protein, Oil Barley—Moisture, Protein |
|
M2.0 Measures Moisture only |
Wheat Corn Soybean Oats Barley Canola/Rapeseed Rice |
|
EM Measures Moisture only |
All Grains |
For more information about the industry moisture standard, see Appendix A: Standard Moisture and Test Weight.
M2.0 calibrations are performed with systems that have an EM2 or EM3 sensor.
Prepare Samples
Preparing your samples is a critical first step towards creating and maintaining an effective moisture curve.
Imitate harvest conditions. When calibrating, imitate harvest conditions as closely as possible.
- Use grain at the ambient outdoor temperature for calibrating. If the grain samples are cool (from air conditioning or cold storage), acclimate them by spreading them out on a clean surface overnight. If you are calibrating outside, keep the samples in the shade. Do not leave them in the sun to warm up.
- Cycle the grain through the hopper or cyclone to reduce differences from grain.
Create precision. HarvestMaster recommends cycling samples multiple times and averaging the readings for both the benchtop device and the GrainGage.
- Use room temperature grain.
- Create the known values by averaging the sample readings from the reference device. Cycle each sample 3–5 times.
- Create and use a moisture curve for each insert configuration you will use during harvest.
- Test in the reference device and in the GrainGage within an hour.
- Use the sensor at harvest temperature. Bring the sensor to harvest temperature by running the combine for at least 30 minutes before doing the chamber calibration.
To create a moisture curve that is representative of the moisture range, encountered during harvest, use samples of at least 6 pounds.
![]() CAUTION: Do not re-wet grain samples. If you need to adjust the moisture content, take a natural sample and dry it down.
CAUTION: Do not re-wet grain samples. If you need to adjust the moisture content, take a natural sample and dry it down.
Annually check and tune moisture curves. Checking and tuning moisture curves each season will give you the best data quality.
Additional Preparation for Samples used with EM Sensors
Plan ahead for calibration. Creating an accurate moisture curve requires using grain samples with a range of moisture percentages. Collecting enough samples to calibrate properly requires advanced planning. HarvestMaster recommends planting grain varieties that will be available for harvest before test plots are ready or harvesting border plots early and drying them to varying moistures.
Collect and prepare samples.
- Use no less than three samples to generate a curve. The more samples the better.
- Use samples that vary in moisture by at least 3% (from lowest to highest moisture content).
Moisture Curve and Chamber Calibration Wizard
To open the moisture curve and chamber calibration wizard,
- Go to Home > Setup > H2 or H3 GrainGage > Calibration.
- Tap Moisture curve and chamber calibration > Open Calibration Wizard.
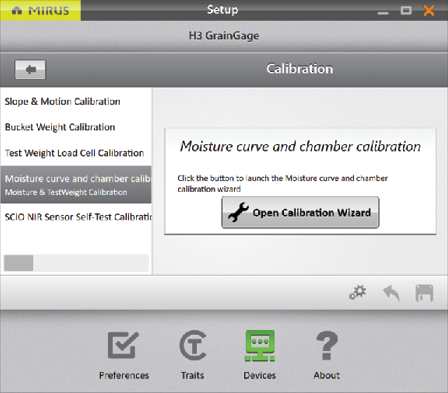
This will take you to the moisture calibration screen. For the next steps, see Create a SCiO Calibration File, Create an M2.0 Calibration File, or Create an EM Calibration File.
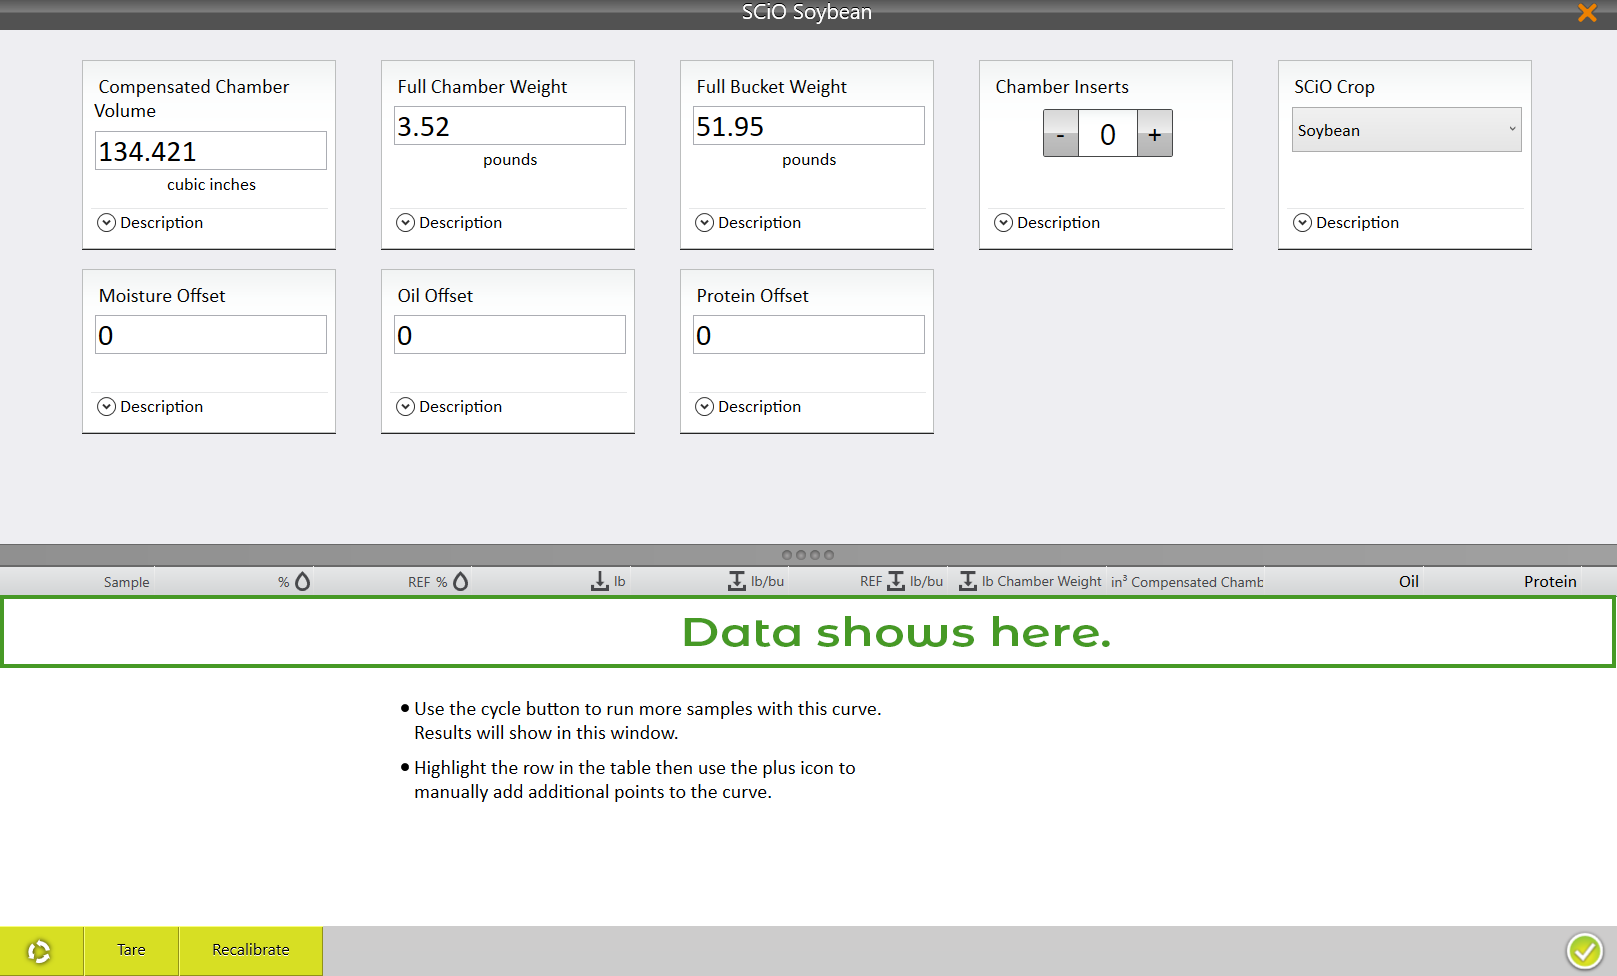
Create a SCiO Calibration File
Note: This is only available with the H3 GrainGage and a SCiO sensor installed.
The purpose of the following calibration is to select a crop and calibrate the test chamber volume (test weight). The default SCiO moisture/protein/oil (where applicable) value in Mirus is compiled from thousands of samples around the world. While it is possible for you to offset that data and make it more relevant, HarvestMaster does not recommend doing so.(If you would like to offset the SCiO moisture/protein/oil (where applicable see SCiO Offset Recalibration.)
To begin the calibration you will need one sample that is at least 6 lb (2.7 kg) at the industry moisture standard.
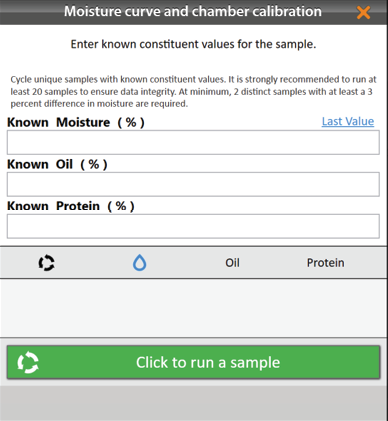
In the Calibration Wizard,
- Enter a Name for the calibration file.
- Enter the Chamber inserts count.
The insert count is the number of inserts present in the chamber. It is used to select default volume for the test chamber, which is important to the accuracy of the system.
For more information about insert counts and installing the inserts, see the H2 Classic GrainGage
Hardware Manual.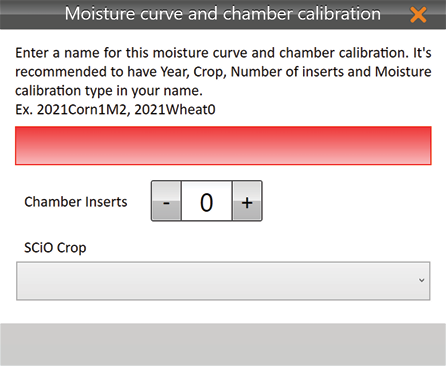
- Select the SCiO Crop.
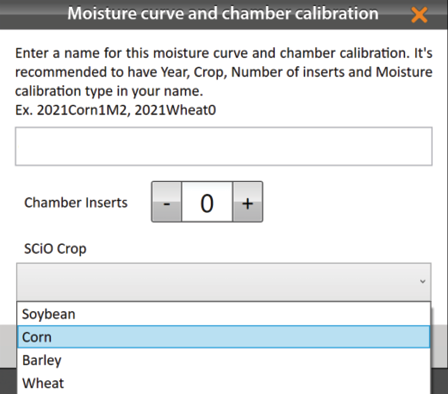
- Tap the next arrow
 .
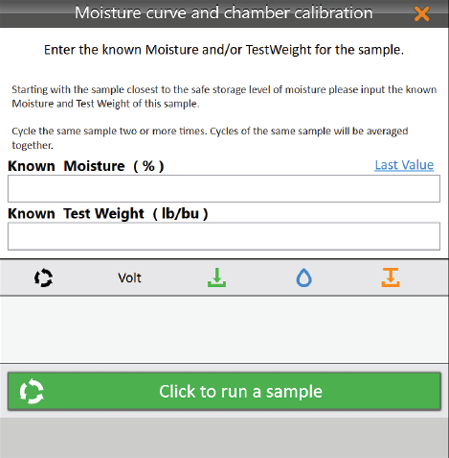
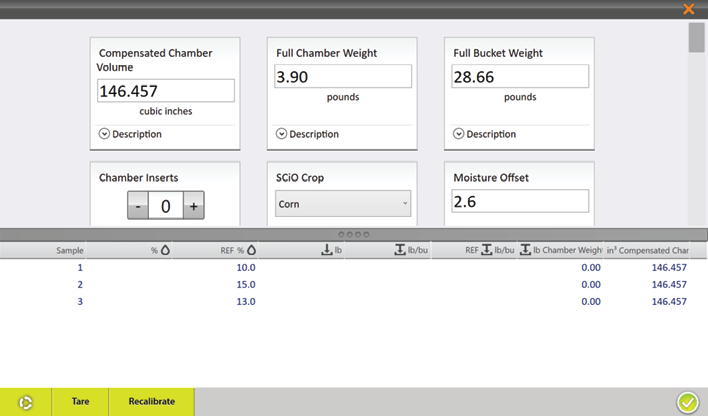
. - Pour the grain sample into the GrainGage hopper to simulate harvest.
- Enter the Known Test Weight.
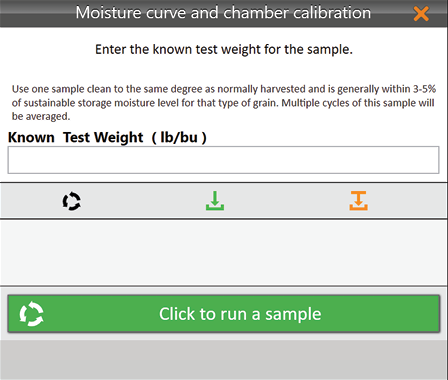
- Tap Click to run a sample.
- Using the same sample, repeat steps 5–7 at least two more times.
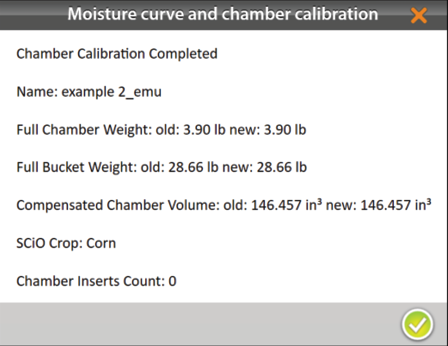
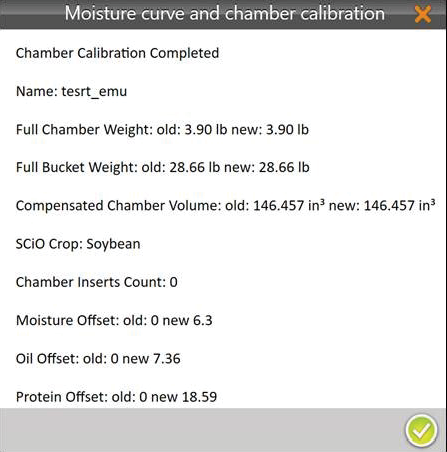
The GrainGage cycles the grain, and Mirus displays details of the calibration. - Tap the check icon
 to display the calibration file.
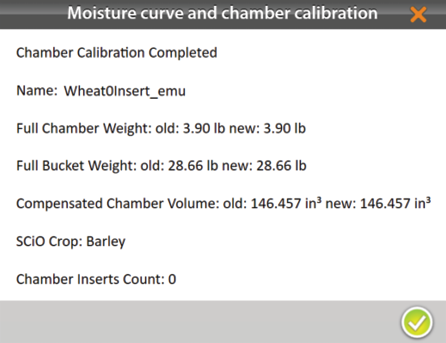
- Tap the green check icon to save the calibration file.
To offset the SCiO data, see SCiO Offset Recalibration (not recommended).
Create an M2.0 Calibration File
Calibrating the chamber to create a calibration file consists of two parts:
- Calibrating with moisture and test weight with the first sample.
- Calibrating with the remaining moisture samples.
To begin the calibration you will need one sample that is at least 6 lb (2.7 kg) at the industry moisture standard.
For more information about the industry moisture standard, see Appendix A: Standard Moisture and Test Weight.
Continue the calibration with a dry grain sample and a wet grain sample (more samples can be used as well). Each sample should be cycled at least three times.
The Calibration Steps in the table below describe each step needed to create a moisture curve.
|
Calibration Steps |
|||
|---|---|---|---|
|
Cycle with Test Weight |
Moisture |
Test Weight |
|
|
1. |
Sample A |
Industry Standard |
Variable |
|
2. |
Cycle Sample A two more times. |
Continue to use the same test weight value. |
|
|
Cycle without Test Weight |
Moisture |
Test Weight |
|
|---|---|---|---|
|
3. |
Sample B |
Dry Grain |
Test weight output should reflect the bench top test weight. |
|
4. |
Cycle Sample B two more times. |
||
|
5. |
Sample C |
Wet Grain |
Test weight output should reflect the bench top test weight. |
|
6. |
Cycle Sample C two more times. |
||
Note: This table reflects the minimum number of cycles needed to create a calibration file. To improve your calibration file, cycle several more moisture samples.
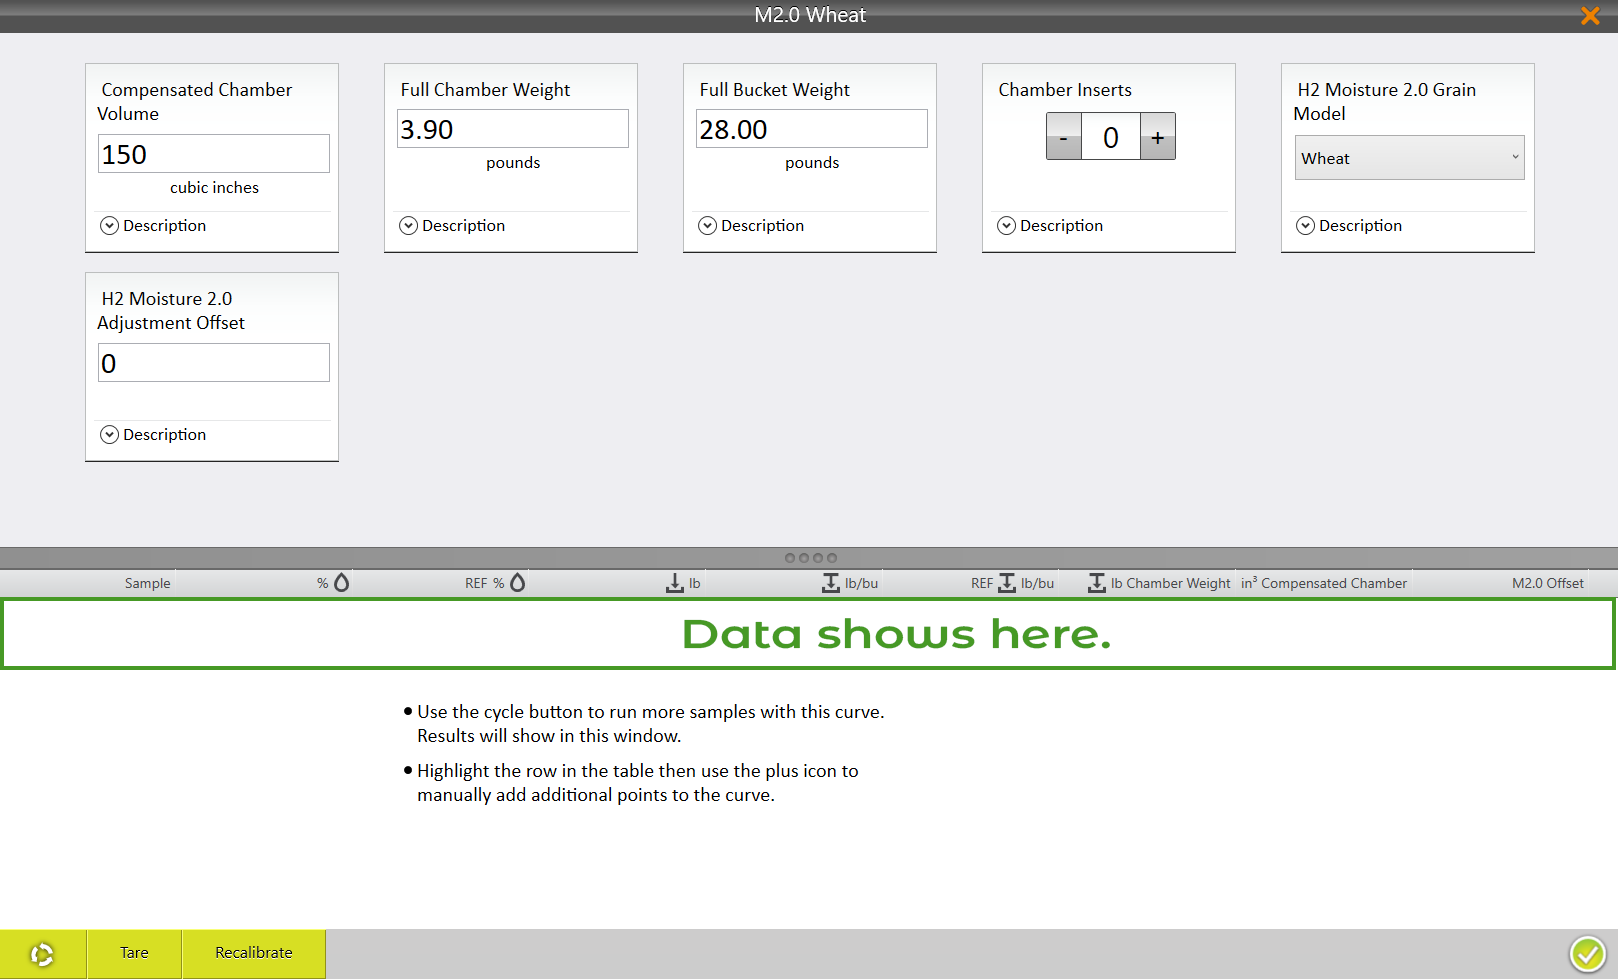
M2.0 Chamber Calibration
In the Calibration Wizard,
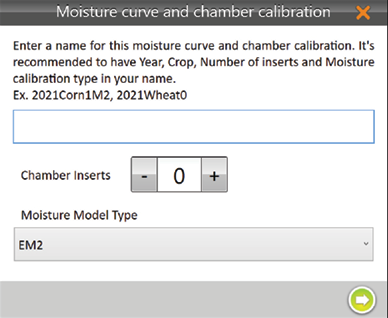
- Enter a Name for the calibration file.
- Enter the Chamber Inserts count.
The insert count is the number of inserts present in the chamber. It is used to select default volume for the test chamber, which is important to the accuracy of the system.
For more information about insert counts and installing the inserts, see the H2 and H3 Classic GrainGage Hardware Manual.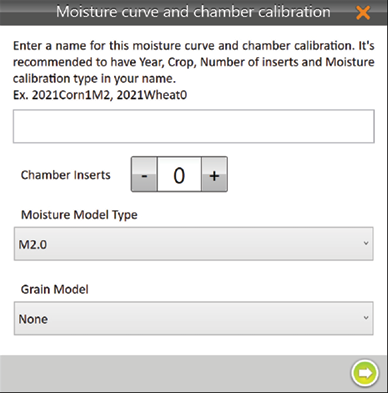
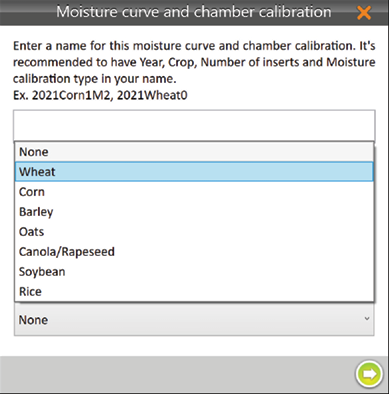
- Under the Moisture Model Type, select M2.0.
Note: If you are harvesting a grain that is not listed here, see Create an EM Calibration File. - Choose the grain you are harvesting.
- Tap the next arrow .
- Calibrate the chamber using moisture and test weight (steps 7–10) and with moisture samples (with no test weight) (steps 10–17).
The following steps explain how to begin a chamber calibration by using moisture and test weight.
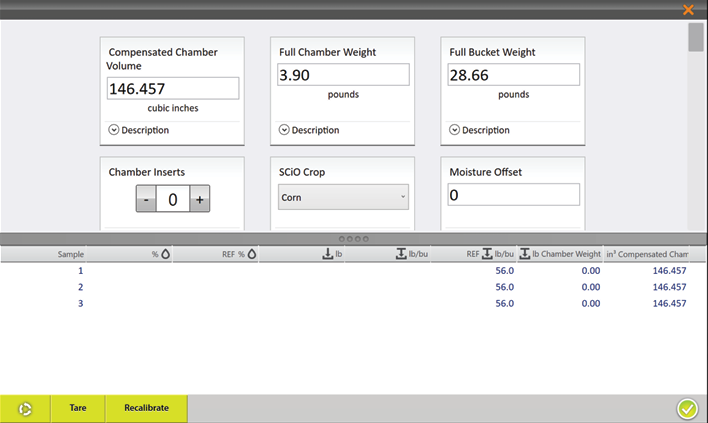
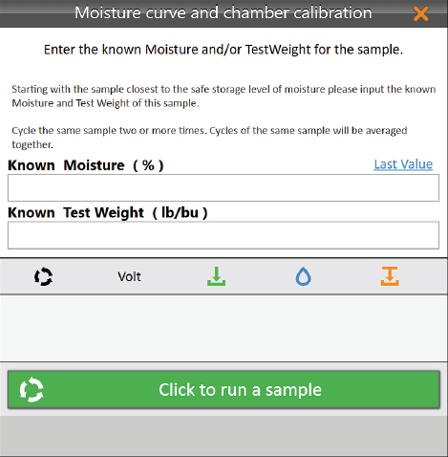
- Pour the grain sample into the GrainGage hopper to simulate harvest.
- Enter the Known Moisture and Test Weight.
- Tap Click to run a sample.
- Using the same sample, repeat steps 7–9 at least two more times.
The following steps explain how to continue a chamber calibration by adding moisture samples (with no test weight).
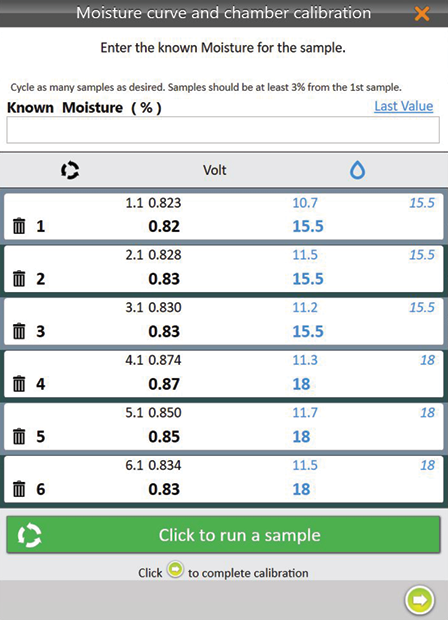
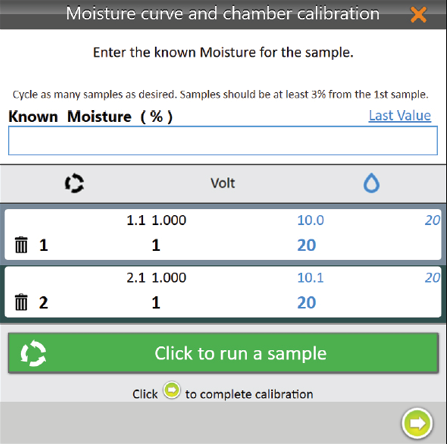
- Pour a grain sample into the GrainGage hopper to simulate harvest.
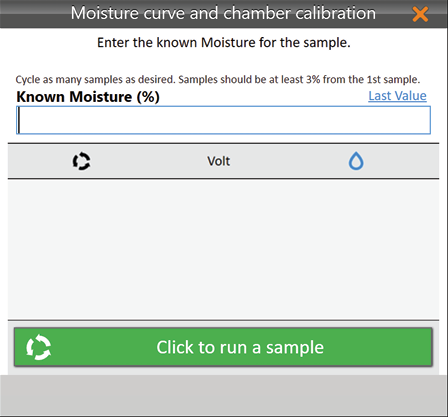
- Enter the Known Moisture.
- Tap Click to run a sample.

- Using the same sample, pour it into the GrainGage hopper again.
Note: TapLast Value to automatically populate the Known Moisture with the same value as the previous sample. - Repeat steps 11–14 until all grain samples have been cycled through the GrainGage.
Note: HarvestMaster recommends using at least three samples and cycling them three times each. - Tap the next arrow
 to complete the calibration.
If the moisture content of your samples do not cover a range of at least 3%, Mirus displays an Insufficient Moisture Range warning.
- Tap Ignore to continue with the current samples.
- Tap Return to add more samples with a variety of moisture percentages.

- Tap the check icon .
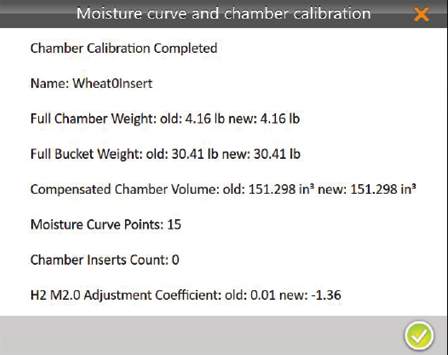
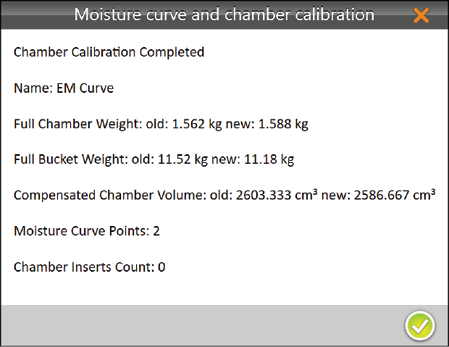
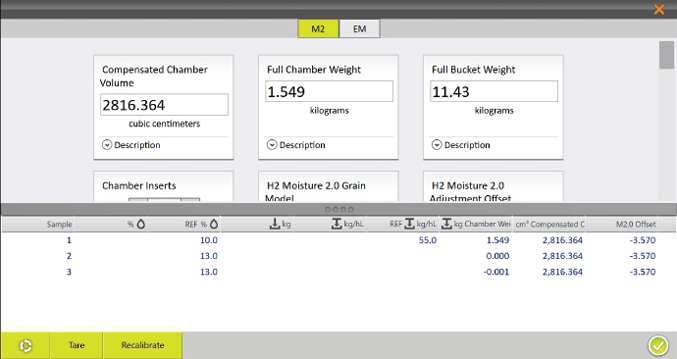
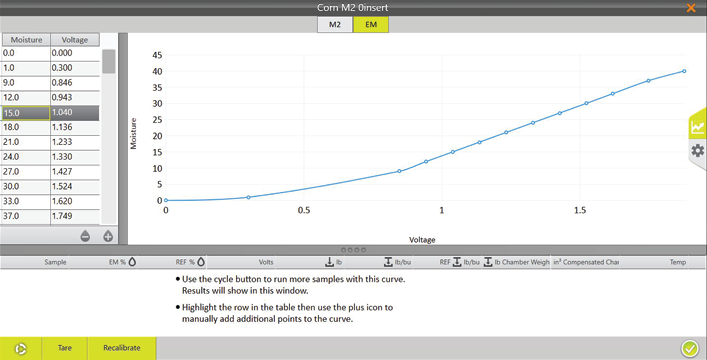
Mirus displays the moisture calibration information.
When this calibration file is selected for harvest, Mirus will use the M2.0 calibration throughout harvest, but it will save the EM calibration for reference. You can select the EM tab to view this saved calibration.
- Tap the check icon
 to save the new M2.0 calibration file.
Create an EM Calibration File
Chamber Calibration Overview
Calibrating the chamber to create a moisture curve consists of two parts:
- Calibrating with moisture and test weight with the first sample.
- Calibrating with the remaining moisture samples.
Both of these parts are necessary to create an accurate moisture curve.
To begin the calibration you will need one sample that is at least 6 lb (2.7 kg) at the industry moisture standard (e.g., the industry moisture standard for corn is 15.5%).
For more information about the industry moisture standard, see Appendix A: Standard Moisture and Test Weight.
Continue the calibration with a dry grain sample and a wet grain sample (more samples can be used as well). Each sample should be cycled at least three times.
The Calibration Steps in the table below describe each step needed to create a moisture curve.
|
Calibration Steps |
|||
|---|---|---|---|
|
Cycle with Test Weight |
Moisture |
Test Weight |
|
|
1. |
Sample A |
Industry Standard |
Variable |
|
2. |
Cycle Sample A two more times. |
Continue to use the same test weight value. |
|
|
Cycle without Test Weight |
Moisture |
Test Weight |
|
|---|---|---|---|
|
3. |
Sample B |
Dry Grain |
Test weight output should reflect the benchtop test weight. |
|
4. |
Cycle Sample B two more times. |
||
|
5. |
Sample C |
Wet Grain |
Test weight output should reflect the benchtop test weight. |
|
6. |
Cycle Sample C two more times. |
||
Note: This table reflects the minimum number of cycles needed to create a moisture curve. To improve your moisture curve, cycle several more moisture samples.
EM Chamber Calibration
In the Calibration Wizard,
- Enter a name for the moisture curve.
- Enter the Chamber Inserts count.
The insert count is the number of inserts present in the chamber. It is used to select default volume for the test chamber, which is important to the accuracy of the system.
For more information on insert counts and installing inserts, see H2 Classic GrainGage Hardware Manual. - Under Moisture Model Type, select EM2.
Note: If you are harvesting wheat, corn, barley, oats, canola/rapeseed, soybean, or rice see, Create an M2.0 Calibration File. - Tap the next arrow .
- Calibrate the chamber using moisture and test weight (steps 6–9) and then with moisture samples (with no test weight) (steps 19–24).
The following steps explain how to begin a chamber calibration by using moisture and test weight.
- Pour the grain sample into the GrainGage hopper to simulate harvest.
- Enter the Known Moisture and Test Weight.
- Tap Click to run a sample.
- Using the same sample, repeat steps 6–8 at least 2 more times.
The following steps explain how to continue a chamber calibration by adding moisture samples (with no test weight).
- Pour a grain sample into the GrainGage hopper to simulate harvest.
- Enter the Known Moisture.
- Tap Click to run a sample.
- Using the same sample, repeat steps 1-3 at least two more times.
Note: Tap Last Value to automatically populate the Known Moisture with the same value as the previous sample. - Repeat steps 10–13 until all grain samples have been cycled through the GrainGage.
Note: HarvestMaster recommends using at least three samples and cycling them three times each. - Tap the next arrow to complete the calibration.
If the moisture content of your samples does not cover a range of at least 3%, Mirus displays an Insufficient Moisture Range warning.
- Tap Ignore to continue with the current samples.
- Tap Return to add more samples with a variety of moisture percentages.
- Tap the check icon .
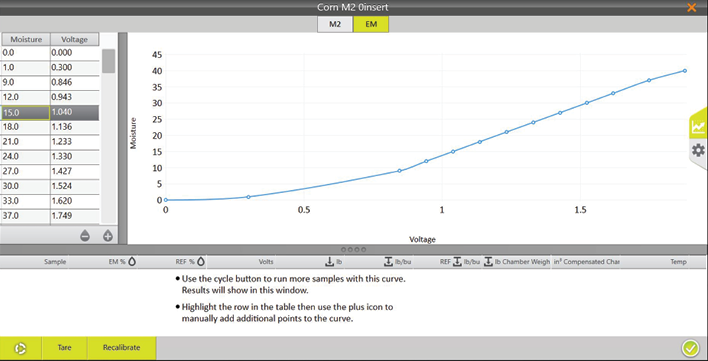
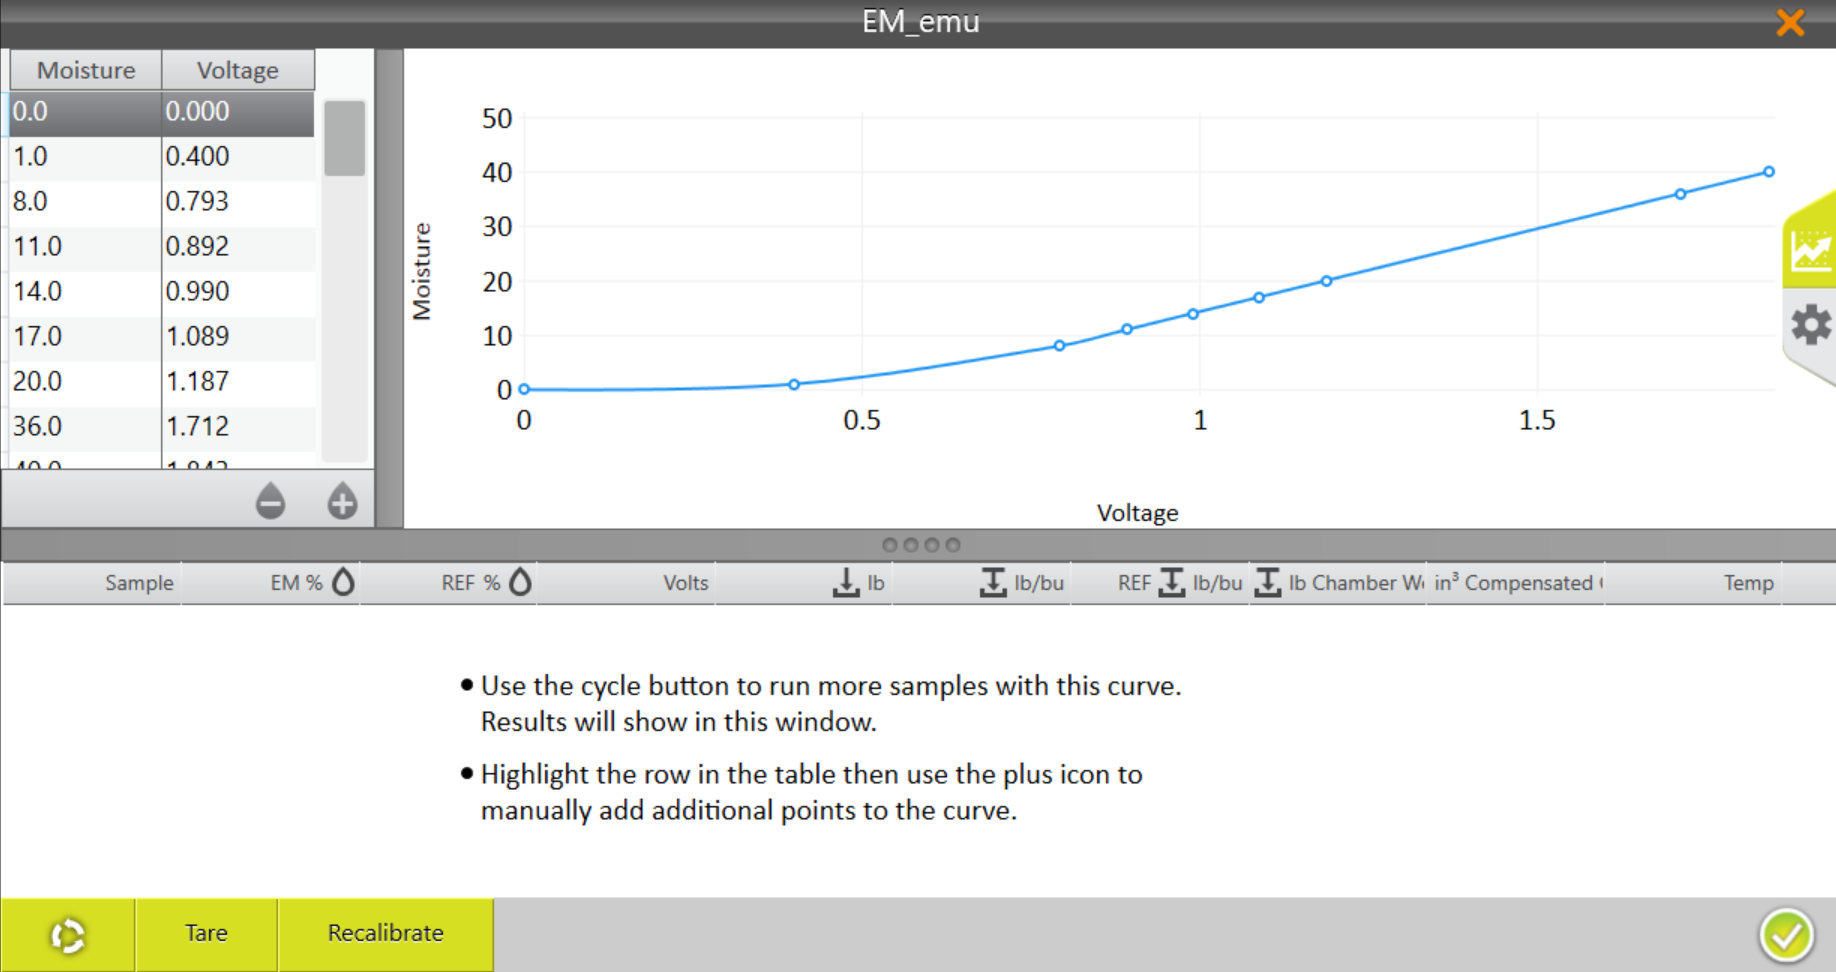
Mirus displays the moisture curve and voltages graphically.
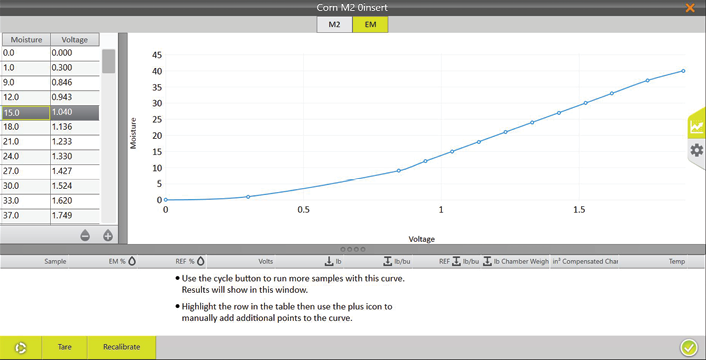
- Tap the check icon to save the new EM moisture curve.
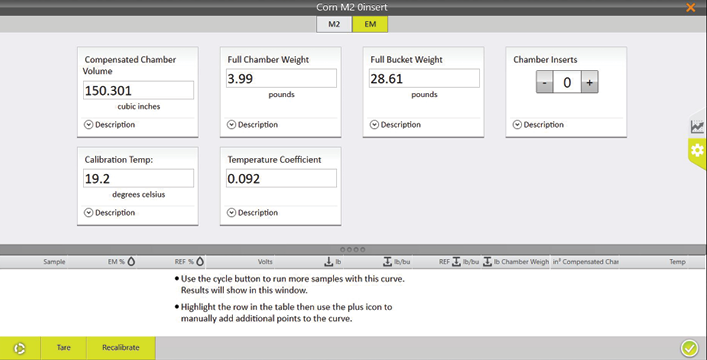
If desired, first tap the gear icon ![]() on the right for more information about this moisture curve.
on the right for more information about this moisture curve.
Note: Only adjust these settings if a HarvestMaster Field Service Engineer tells you to.
Test a Calibration File (Moisture Curve)
HarvestMaster recommends testing the new calibration file against different samples to confirm the data.
- Test the grain samples with a reference device by cycling sub-samples from the larger sample 3–5 times and averaging the data. The averages are the known values.
- Within the hour, take the samples out to the GrainGage. If you are calibrating outside, make sure the samples stay in the shade.
- Open Mirus.
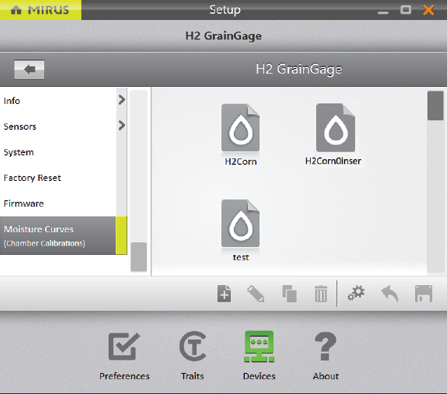
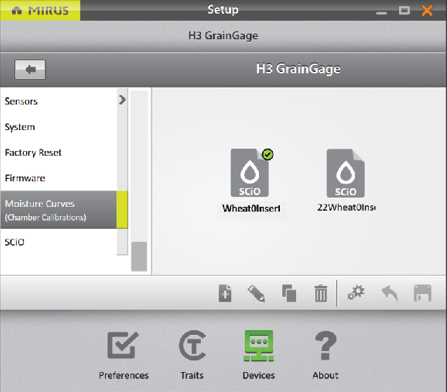
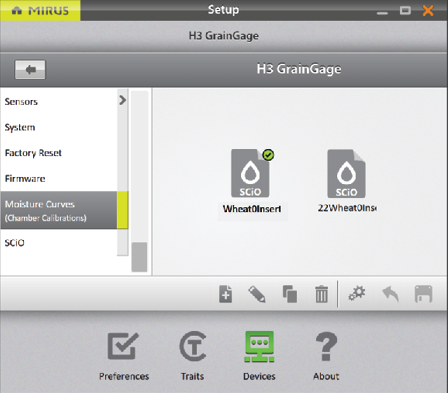
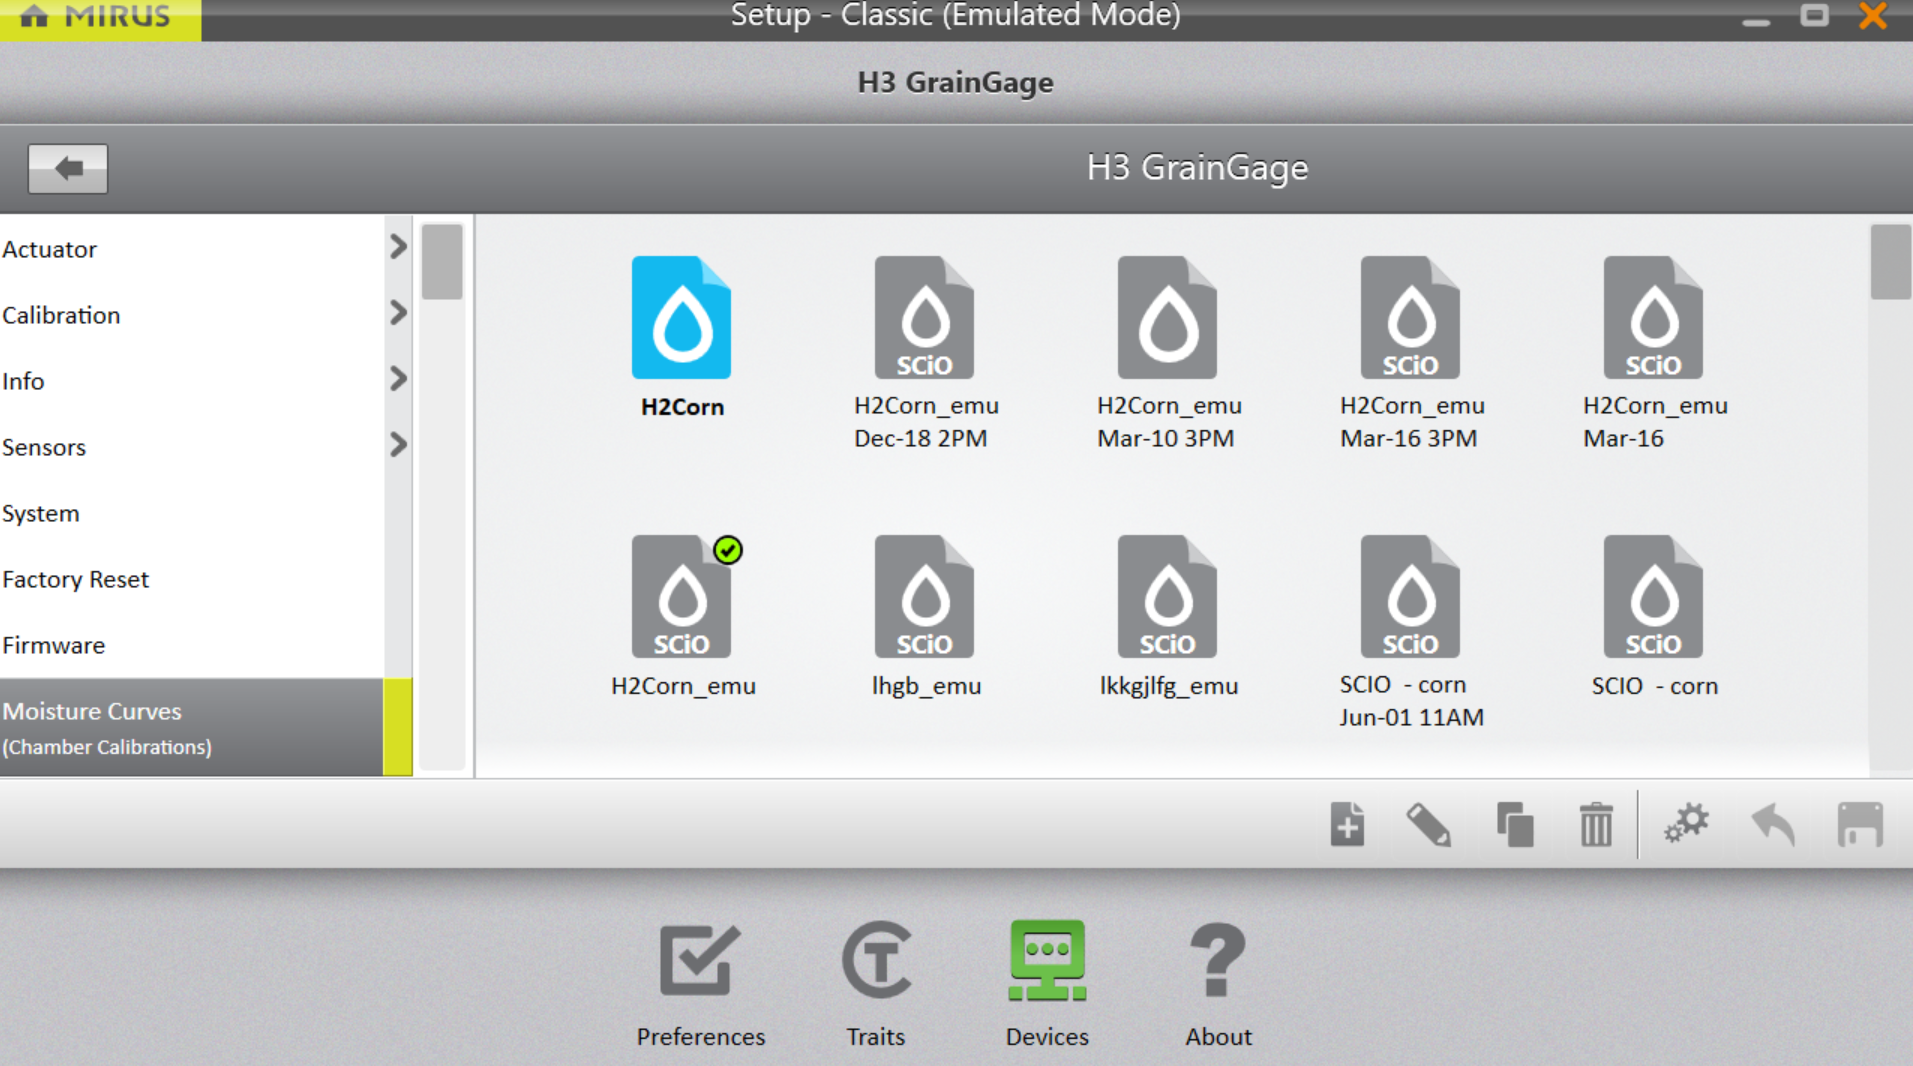
- Go to Setup > H2 or H3 GrainGage > Moisture Curves.
- Select the moisture curve you want to test.
- Tap the edit icon
 .
.
- Pour the grain sample into the hopper (to simulate harvest). Release the isolation gate so that the grain drops into the GrainGage uniformly.
- Tap the Cycle button
 .
.
Mirus takes its measurements and displays the readings from the sample.
- Cycle the sample through the GrainGage (repeat steps 7 and 8) two more times. This allows you to average the data readings for the sample.
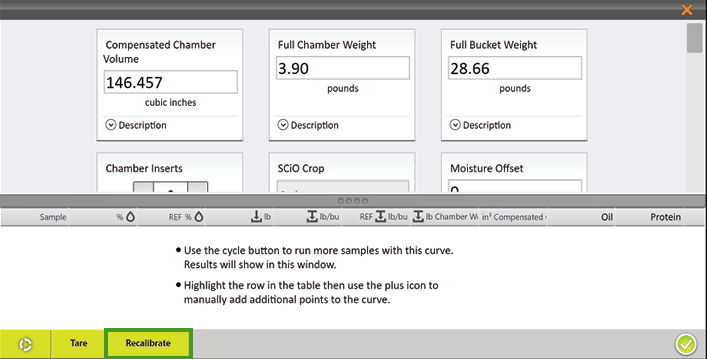
- If the calibration file needs to be tuned to match the sample, tap Recalibrate.
Test Weight Recalibration
The test weight recalibration is similar for SCiO, M2.0, and EM.
- Open Mirus.
- Go to Setup > H3 GrainGage > Moisture Curves or Setup > H2 GrainGage > Moisture Curves based on your GrainGage model.
- Select the calibration you want to modify.
- Tap the edit icon .
- Tap Recalibrate.
- Select Test Weight and tap the next arrow
 .
.

- Pour the grain sample into the hopper (to simulate harvest). Ensure the isolation gate is open so the grain drops into the GrainGage.
- Enter the Known Test Weight.
- Tap Click to run a sample.
- After you have run one sample 3–5 times, tap the next arrow .
Mirus displays the modified calibration information.
- Tap the check icon .
- Tap the check icon to save.
SCiO Offset Recalibration
Note: This is not recommended. If you offset the SCiO data, HarvestMaster recommends using 100 samples (20 samples minimum).
- Open Mirus.
- Go to Setup > H3 GrainGage > Moisture Curves.
- Select the SCiO calibration you want to test.
- Tap the edit icon .
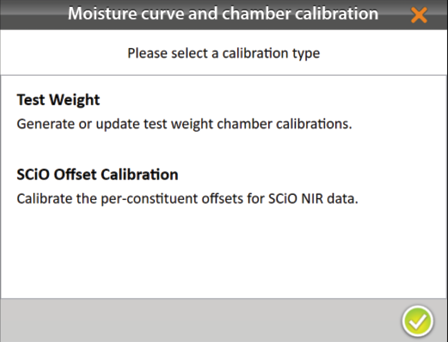
- Tap Recalibrate.
- Select SCiO Offset Calibration.
- Pour the grain sample into the hopper (to simulate harvest). Ensure the isolation gate is open so the grain drops into the GrainGage.
- Enter the Known Moisture.
- Enter the Known Oil, if applicable.
- Enter the Known Protein, if applicable.
- Tap Click to run a sample.
- After you have run all the samples 3–5 times each, tap the next arrow .
Mirus will display the recalibrated values.
- Tap the check icon .
- On the final screen, tap the check icon to save the calibration file.
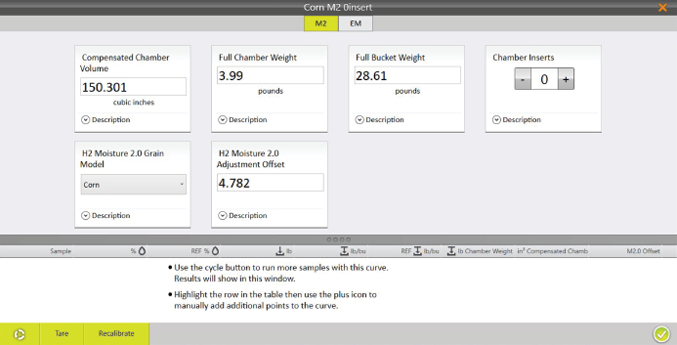
M2.0 Moisture Model Recalibration
![]() CAUTION: Test Weight Recalibration must be completed before following the steps in this section.
CAUTION: Test Weight Recalibration must be completed before following the steps in this section.
To adjust an M2.0 moisture calibration,
- Open Mirus.
- Go to Setup > H2 or H3 GrainGage > Moisture Curves.
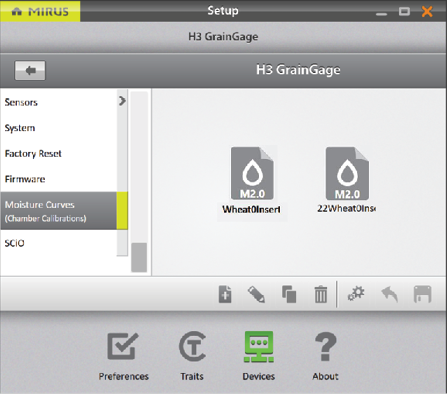
- Select the moisture curve you want to adjust.
- Tap the edit icon .
- Tap Recalibrate.
Note: Adjusting the M2.0 calibration factors in the samples originally used in the calibration.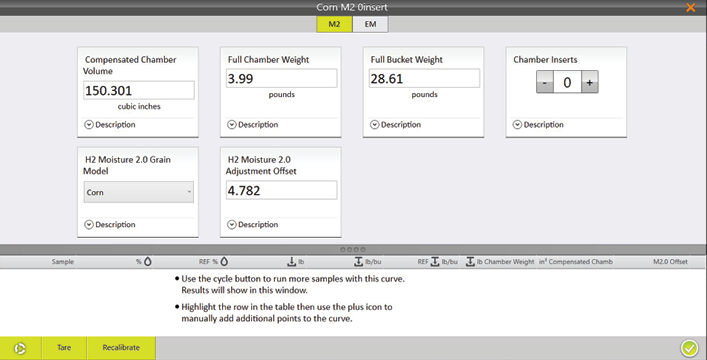
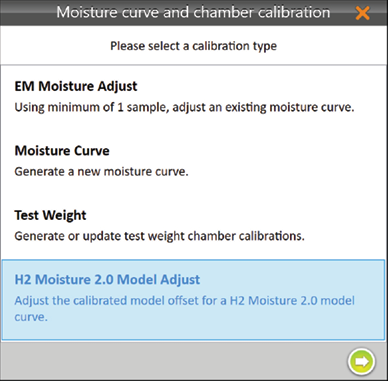
- Select H2 Moisture 2.0 Model Adjust and tap the next arrow
 .
.
Note: HarvestMaster recommends using different moisture samples (spread 2-3% apart) to adjust and existing moisture curve.
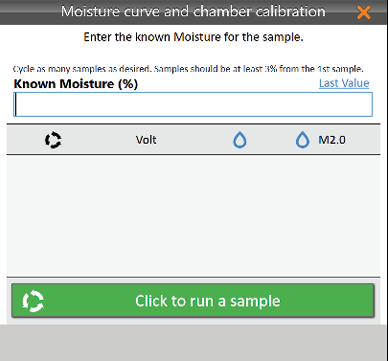
- Pour the grain sample into the hopper (to simulate harvest). Ensure the isolation gate is open so the grain drops into the GrainGage.
- Enter the Known Moisture percentage.
- Tap Click to run a sample.
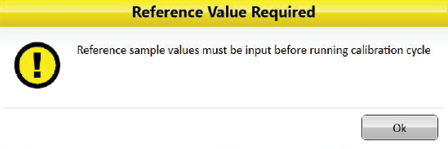
If you do not enter a moisture value you will see the Reference Value Required warning.
- Repeat steps 7–9 with all moisture samples.
HarvestMaster recommends using multiple samples when possible.
Note: The Last Value button can be used to fill the Known Moisture field with the previous percentage when the same sample is run multiple times.
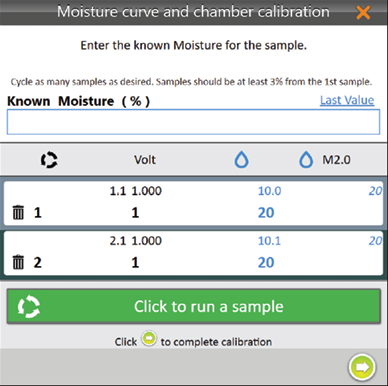
- Tap the next arrow to complete the recalibration.
Mirus displays the changes in the chamber calibration settings. - Tap the check icon .
Mirus displays the moisture curve and voltages.
- Tap the check icon to save the new M2.0 calibration file.
EM Moisture Recalibrate
When recalibrating an EM Moisture curve, the slope of the curve is not changed. The entire curve shifts to match the new sample. Fine-tuning a curve is often done later in the season as additional moisture samples are available.
![]() CAUTION: Test Weight Recalibration must be completed before following the steps in this section.
CAUTION: Test Weight Recalibration must be completed before following the steps in this section.
To adjust an M2.0 moisture calibration,
- Open Mirus.
- Go to Setup > H2 or H3 GrainGage > Moisture Curves.
- Select the EM moisture curve you want to adjust.
- Tap the edit icon .
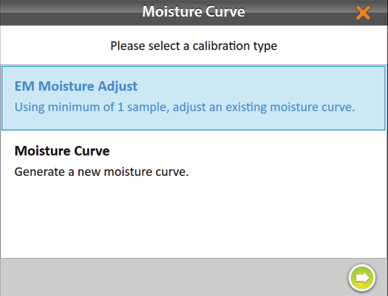
- Tap Recalibrate.
- Select Moisture Adjust and tap the next arrow .
Note: Multiple samples can be used to adjust an existing moisture curve. If test weight needs to be adjusted, see the next section.
- Pour the grain sample into the hopper (to simulate harvest). Ensure the isolation gate is open so the grain drops into the GrainGage.
- Enter the Known Moisture percentage.
- Tap Click to run a sample.
- Repeat steps 12–14 with the same sample at least two more times.
Note: The Last Value button can be used to fill the Known Moisture field with the previous percentage when the same sample is run multiple times. - Tap the next arrow to complete the recalibration.
Mirus displays the adjusted moisture curve with its moisture percentages and voltages.

Manual Calibration of an EM Moisture Curve Using Excel
HarvestMaster provides a spreadsheet for creating a two-point calibration online. It can be downloaded here: www.harvestmaster.com/data/files/mirus/EM2 Sample Curves 2018.xlsx. Follow the instructions in the spreadsheet for creating the curve.
Calibrate High Moisture Corn on an EM Moisture Curve
When calibrating with high moisture corn samples, some moisture curves do not follow a linear voltage relationship. HarvestMaster recommends manually adjusting the upper half of moisture curves with grain samples above 26%.
To do this type of adjustment, start by using samples below 26% moisture to create a base curve as described in Chamber Calibration.
Once you have a base curve, use 3–5 samples (multiple samples required) that are 26% and above to manually adjust the top half of the curve:
- With the moisture curve open, cycle samples above 26% through the GrainGage 3–5 times each. Average the moisture readings for each sample.
- Calculate the moisture percentage offsets.
The offset is the difference between the benchtop sensor’s moisture measurement and the GrainGage’s moisture measurement.
For example, Sample One has the following moisture measurements:
- Benchtop sensor: 33%
- GrainGage: 31.8%
The offset would be 33% − 31.8% = +1.2%
- If the average readings of the higher moisture samples do not match the moisture curve, average all the sample offsets.
For example, if your benchtop sensor says Sample One is +1.2%, Sample Two is +0.8%, and Sample Three is +1.0%, the average offset is +1.0%.
- Open Mirus.
- Go to Setup > H2 or H3 GrainGage > Moisture Curves.
- Select the moisture curve you want to test.
- Tap the edit icon .
- Add the average offset to each moisture point with the exception of the 0 and 1 moisture points (never adjust 0 or 1). Subtract for a negative average offset. Do not adjust voltages.
Add or subtract the offsets here.
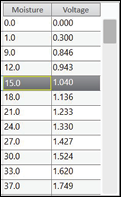
As needed add or remove points in the curve here.

In the example above, readings from the benchtop sensor indicate that the grain samples above 26% have, on average, 1% higher moisture than the percentages in the base moisture curve. Therefore, in the curve:
- 26% would become 27%
- 29% would become 30%
- 40% would become 41%
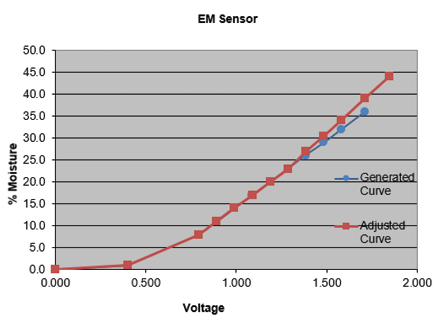
The lower and upper ends of the newly adjusted moisture curve should graphically depict a smooth point-to-point transition (as illustrated below). If it isn’t smooth, HarvestMaster recommends generating a new curve.
- Once the curve is adjusted, recheck samples, starting with the lower half of the moisture curve.
- After adjusting the lower half of the curve, cycle samples above 26% and repeat the adjustment procedure (steps 1–8 above). Only adjust the points above 26% and leave the points on the lower half alone.
In some cases, the higher the moisture, the steeper the slope of the curve. This is indicated by a steady increase in the difference between the moisture curve and the moisture percentages in the grain samples as the moisture values increase.
This scenario is not uncommon in high moisture corn. It requires adding extra percentage points as the moisture value increases. For example, adding the following percentages to the default curve will help match the steeper slope in higher moisture grain samples:
- Add 1% to moisture values 26% to 27%
- Add 1.5% to moisture values 28% to 30%
- Add 2% to moisture values above 30%
 The following tables illustrate this type of adjustment.
|
Original Curve |
Adjusted Curve |
|||
|---|---|---|---|---|
|
Moisture |
Voltage |
Moisture |
Voltage |
|
|
0.0 |
0.000 |
0.0 |
0.000 |
|
|
1.0 |
0.400 |
1.0 |
0.400 |
|
|
8.0 |
0.793 |
8.0 |
0.793 |
|
|
11.0 |
0.892 |
11.0 |
0.892 |
|
|
14.0 |
0.990 |
14.0 |
0.990 |
|
|
17.0 |
1.089 |
17.0 |
1.089 |
|
|
20.0 |
1.187 |
20.0 |
1.187 |
|
|
23.0 |
1.286 |
23.0 |
1.286 |
|
|
26.0 |
1.385 |
27.0 |
1.385 |
|
|
29.0 |
1.483 |
30.5 |
1.483 |
|
|
32.0 |
1.582 |
34.0 |
1.582 |
|
|
36.0 |
1.713 |
39.0 |
1.713 |
|
|
40.0 |
1.845 |
44.0 |
1.845 |
|